Figure 3.

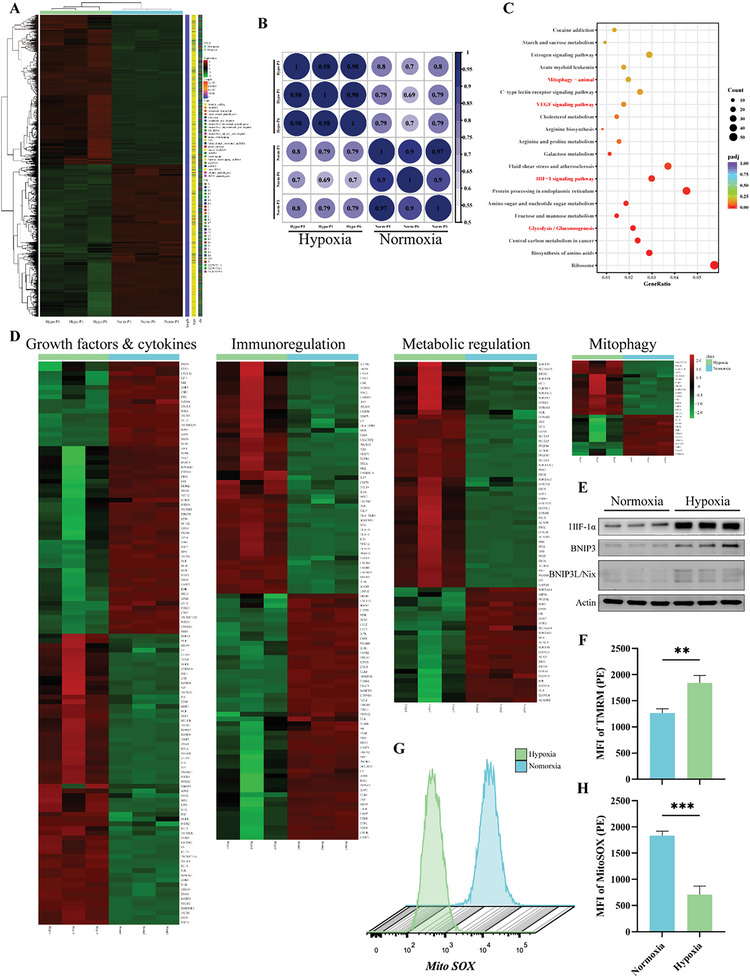
Hypo‐MSCs and Norm‐MSCs exhibit different gene expression profile by RNA‐seq analysis. A) Heat map indicated the difference in global gene expression profiles between Hypo‐MSCs (n = 3) versus Norm‐MSCs (n = 3). B) Pearson's correlation analysis demonstrated correlation of expression profiles between Hypo‐MSCs and Norm‐MSCs between P1–P6 generations. C) Kyoto Encyclopedia of Genes and Genomes (KEGG) enrichment analysis demonstrated pathway enrichment of difference‐expressed genes between Hypo‐MSCs and Norm‐MSCs. D) Heat map illustrated differential genes in cytokines, immune regulation, metabolism, and mitophagy in Hypo‐MSCs and Norm‐MSCs. E) Mitophagy‐related proteins expression in Norm‐MSCs and Hypo‐MSCs were analyzed by WB. HIF‐1α, Hypoxia Inducible Factor 1 Subunit Alpha; BNIP3, BCL2/Adenovirus E1B 19 kDa Protein‐Interacting Protein 3. F) Measured the mitochondrial membrane potential of Norm‐MSCs and Hypo‐MSCs by flow cytometry. G,H) Flow cytometry detected and quantified the mean fluorescence intensity (MFI) of superoxide in mitochondria. *p < 0.05, **p < 0.01, ***p < 0.001, and ****p < 0.0001.
