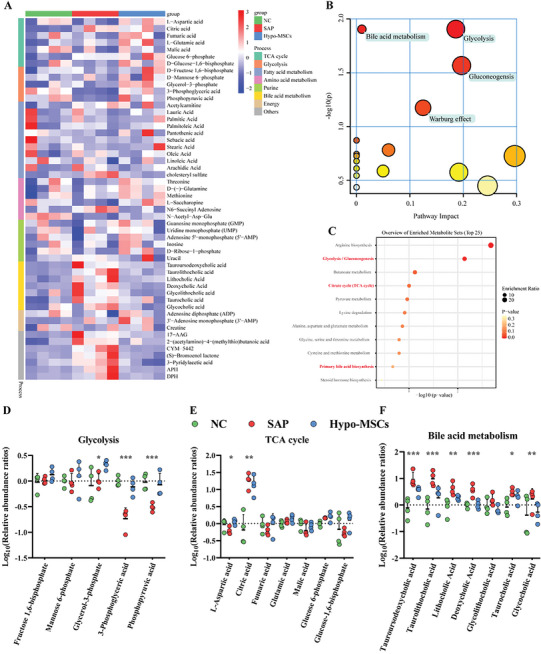
Figure 6.

Reversal of mitochondrial function drives metabolic reprogramming in the pancreas. A) Unclustered heat map showing the relative abundance of 53 metabolites in the pancreas of NC, SAP, and Hypo‐MSCs treated groups. B) Integrative pathway and C) enrichment analysis using MetaboAnalyst of reversal metabolites in the pancreas after Cargocytes treatment. Dot plots of relative abundance of D) glycolysis‐associated metabolites, E) TCA‐associated metabolites, and F) bile acid metabolites in pancreas of NC or SAP or Cargocytes‐treated. *p < 0.05, **p < 0.01, ***p < 0.001, and ****p < 0.0001.
