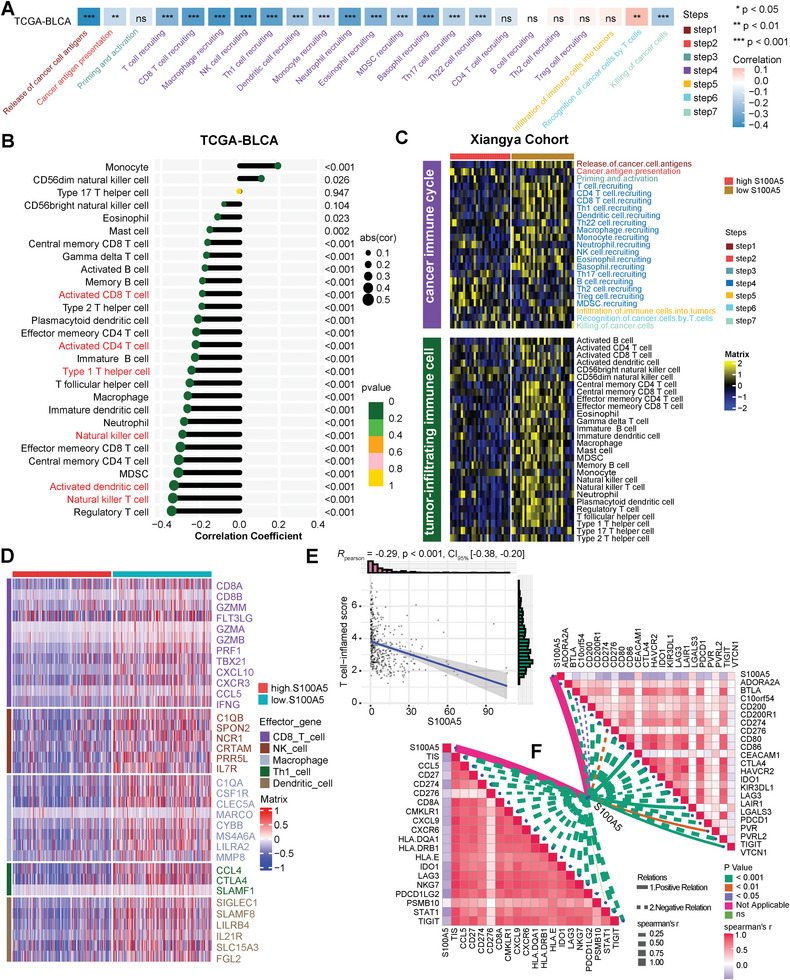
Figure 1.

Correlations between S100A5 and tumor microenvironment (TME) characteristics in TCGA‐BLCA and Xiangya cohort. A) Correlation between S100A5 and cancer‐immunity cycles in TCGA‐BLCA cohort. Different colors represent different cycles; Positive correlation is marked in red, while negative correlation is marked in blue. B) Correlation between S100A5 and tumor‐infiltrating immune cells (TIICs) using ssGSEA algorithm in TCGA‐BLCA cohort. C) Validation the role of S100A5 with cancer‐immunity cycles and TIICs using ssGSEA algorithm in Xiangya cohort. Yellow represents higher infiltration cells, while blue represents lower infiltration cells. D) Different expression patterns of effector genes of CD8+ T cells, dendritic cells (DCs), macrophage cells, natural killer (NK) cells and type 1 T helper (Th1) cells between high and low S100A5 groups; Red represents higher expressed genes, while blue represents lower expressed genes. E) Correlation between S100A5 and pan‐cancer T cell‐inflamed score (TIS). F) Correlation between S100A5 and TIS related genes (bottom left) and immune checkpoint inhibitor (ICI) genes (upper right); Positive correlation was marked in red, while negative correlation was marked in blue. ns, not statistically significant. *p < 0.05; **p < 0.01; ***p < 0.001.
