
Figure 2.
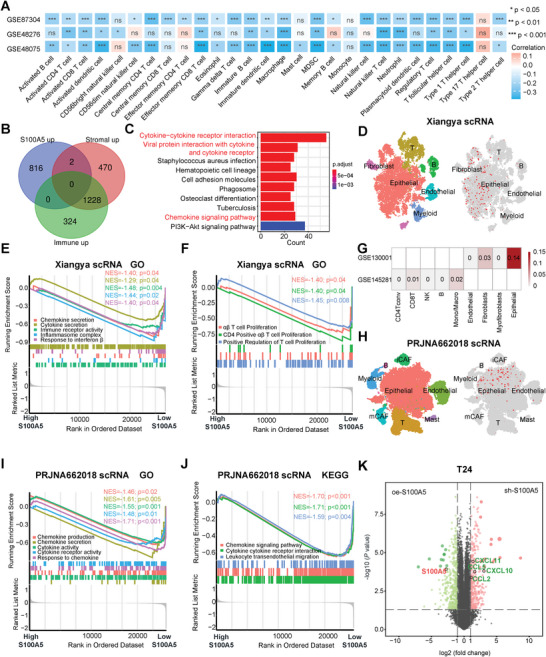
S100A5 specifically expressed on tumor cells and inhibited pro‐inflammatory cytokine and chemokines secretion. A) Correlation between S100A5 and tumor‐infiltrating immune cells (TIICs) using the ssGSEA algorithm in the GSE87304, GSE48276, and GSE48075 cohorts. B) Venn Diagram showing common differentially expressed genes (DEGs) between the high S100A5, stromal score and immune score groups. C) KEGG enrichment results for common DEGs. D) tSNE plot of all single cells and S100A5 expression patterns in Xiangya scRNA‐seq. E,F) GSEA shows the enrichment of cytokine and chemokine secretion related pathways E) and T cell infiltration‐related pathways F) between different S100A5 expression groups in malignant epithelial cells in the Xiangya scRNA‐seq cohort. NES: normalized enrichment score. G) S100A5 expression levels in the TME (GSE130001) and blood cells (GSE145281). H) tSNE plot of all single cells and S100A5 expression patterns in the PRJNA662018 scRNA cohort. iCAF, inflammatory cancer‐associated fibroblasts; mCAF, myo‐cancer‐associated fibroblasts. I,J) GSEA shows GO I) and KEGG J) enrichment of cytokine and chemokine secretion‐related pathways between different S100A5 expression groups in malignant epithelial cells in the PRJNA662018 scRNA cohort. K) Volcano plot showing the major DEGs between the knockdown and overexpression S100A5 groups in T24 cell. ns, not statistically significant. *p < 0.05; **p < 0.01; ***p < 0.001.