Figure 6.

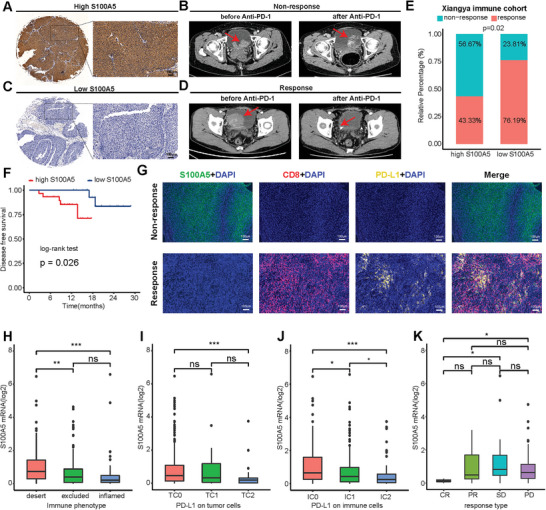
Relationship between S100A5 expression and immune checkpoint blockade (ICB) response. A) Representative immunohistochemical (IHC) image of high S100A5 expression patient. Scale bar, 100 µm. B) Representative CT image for patient with progressive disease after anti‐PD‐1 treatment. C) Representative IHC image of low S100A5 expression patient. Scale bar, 100 µm. D) Representative CT image for patient with complete response after anti‐PD‐1 treatment. E) Relative percentage of patients with clinical response to immunotherapy between different S100A5 expression groups in Xiangya immune cohort. Yellow, immunotherapy response group; Blue, non‐response group. F) Disease‐free survival (DFS) of patients with different S100A5 IHC scores in Xiangya immune cohort. G) Representative multi‐color IF images for S100A5 (green), CD8 (red), PD‐L1 (yellow) and DAPI (blue) in non‐response and response group patients. Scale bars, 100 µm. H) Expression of S100A5 on desert, excluded, and inflamed immune phenotypes in IMvigor210 cohort. I,J) Expression of S100A5 on patients with different PD‐L1 expression on tumor cells I) and immune cells J) in IMvigor210 cohort. K) Correlation between S100A5 expression values and immunotherapy response in the desert phenotype of IMvigor210 cohort. Different color represents different response type. CR: complete response; PR: partial response; SD: stable disease; PD: progressive disease. ns, not statistically significant. *p < 0.05; **p < 0.01; ***p < 0.001.
