
Figure 5.
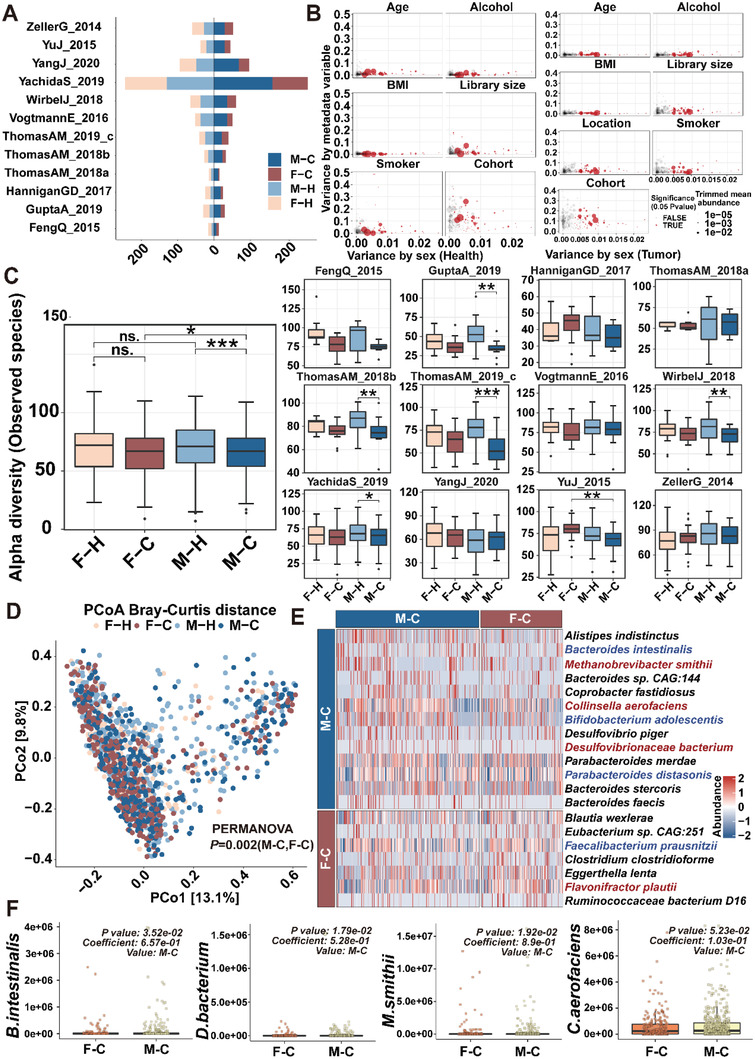
Gut microbiome is sex‐biased in CRC patients. A) The number of samples in the four groups from 12 cohorts with metagenomic data. B) Potential confounding of individual microbial species associations by patient demographics. Variance explained by sex was plotted against variance explained by different putative confounding factors (age, BMI, sex, cohort or other factors) for individual microbial species. Each species is represented by a dot proportional in size to its abundance; core microbial markers identified in the meta‐analysis are highlighted in red. C) Alpha diversity as measured with the number of observed species was computed in all cohorts. P‐values were computed using a two‐sided Wilcoxon test, while the overall P value was calculated using a two‐sided blocked Wilcoxon test in the left. D) Principal coordinate analysis (PCoA) of samples from all 12 cohorts based on Bray–Curtis distance, which shows that microbial composition was different between F‐H, F‐C, M‐H, and M‐C. E) Heatmap for gut microbiome of F‐C and M‐C. The protective bacterial species are colored in red and the potential pathogenic bacterial species are colored in blue. F) The abundance of B. intestinalis, D. bacterium, M. smithii, and C. aerofaciens in F‐C and M‐C. The significance threshold is the default P‐value threshold in MaAsLin2. M‐C: male CRC patients; F‐C: female CRC patients; M‐H: male healthy individuals; F‐H: female healthy individuals. Dot plot reflects data points from independent experiment.