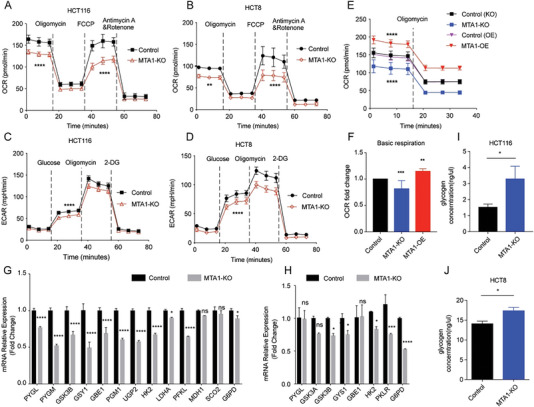
Figure 2.

MTA1 enhances global bioenergetic activity. A,B) OCR trace of MTA1‐KO and control HCT116 colon cancer cells (A) and HCT8 (B). The values are the mean ± SD (****p < 0.0001, **p < 0.01), two‐way ANOVA, Sidak's multiple comparisons test. C,D) ECAR trace of MTA1‐KO and control HCT116 (C) and HCT8 (D) cells. The values are the mean ± SD (****p < 0.0001), two‐way ANOVA, Sidak's multiple comparisons test. E,F) Basic respiration of MTA1‐KO and MTA1‐OE HCT116 cells (E) and statistical analysis (F). The values are the mean ± SD (****p < 0.0001, ***p < 0.001, and **p<0.01), n = 3 replicate/group, two‐way ANOVA, Tukey's multiple comparisons test. G) The mRNA levels of PYGL, PYGM, GSK3B, GYS1, GBE1, PGM1, UGP2, HK2, LDHA, PFKL, MDH1, SCO2, and G6PD in MTA1‐KO and control HCT116 cells were examined by real‐time PCR. The values are the mean ± SD (****p < 0.0001, *p < 0.05; ns, not significant), Student's t‐test, n = 3 replicate/group. H) The mRNA levels of PYGL, GSK3A, GSK3B, GYS1, GBE1, HK2, PKLR, and G6PD in MTA1‐KO and control HCT8 cells were examined by real‐time PCR. The values are the mean ± SD (****p < 0.0001, ***p < 0.001, *p < 0.05; ns, not significant), Student's t‐test, n = 3 replicate/group. I,J) The glycogen level in MTA1‐KO and control HCT116 (I) and HCT8 (J) cells. The values are the mean ± SD (*p < 0.05), Student's t‐test, n = 3 replicate/group.
