Figure 3.

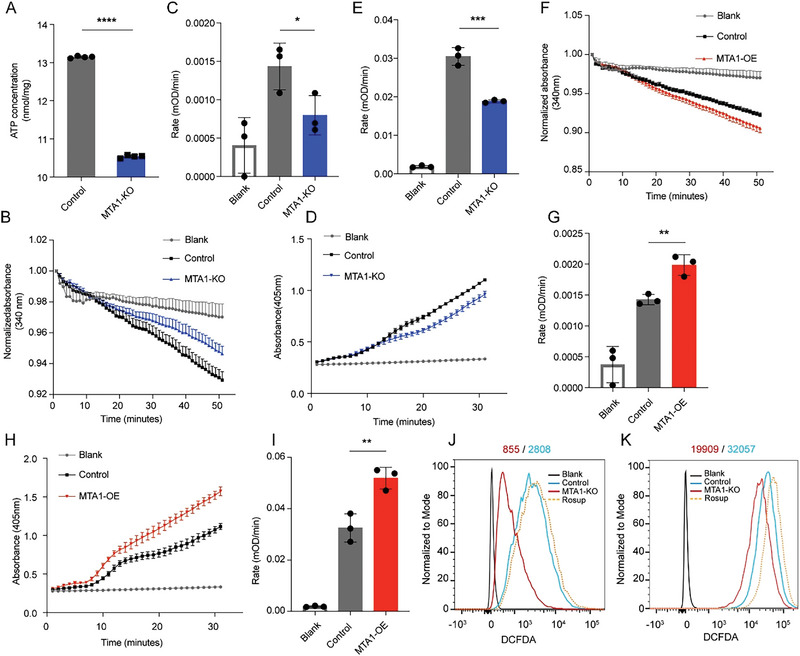
MTA1 facilitates mitochondrial metabolism reprogramming in CRC cells. A) The ATP level in MTA1‐KO and control HCT116 cells. The values are the mean ± SD (****p < 0.0001), Student's t‐test, n = 4 replicate/group. B,C) The activity of ATP synthase was measured as the molar conversion of NADH to NAD+ and is presented as the decrease in absorbance at 340 nm in MTA1‐KO and control HCT116 cells versus their control cells. The values are the mean ± SEM (B). The rate of decrease in absorbance at 340 nm over time in MTA1‐KO and control HCT116 cells (C). The values are the mean ± SD (*p < 0.05), Student's t‐test, n = 3 replicate/group. D,E) The level of ATP synthase was measured as the percentage of alkaline phosphatase activity and is presented as the increase in absorbance at 405 nm in MTA1‐KO and control HCT116 cells (D). The rate of increase in absorbance at 405 nm per min in MTA1‐KO and control cells (E). The values are the mean ± SD (***p < 0.001), Student's t‐test, n = 3 replicate/group. F,G) The activity of ATP synthase was measured as the decrease in absorbance at 340 nm in MTA1‐OE and control HCT116 cells (F). The rate of decrease in absorbance at 340 nm over time in MTA1‐OE and control HCT116 cells (G). The values are the mean ± SD (**p < 0.01), Student's t‐test, n = 3 replicate/group. H,I) The level of ATP synthase was measured as the increase in absorbance at 405 nm in MTA1‐OE and control HCT116 cells (H). The rate of increase in absorbance at 405 nm per min in MTA1‐OE and control HCT116 cells (I). The values are the mean ± SD (**p < 0.01), Student's t‐test, n = 3 replicate/group. J,K) DCF intensity in MTA1‐KO and control HCT116 (J) and HCT8 (K) cells. Rosup (50 µg mL−1) was used as a positive control in the ROS assay.
