Figure 4.

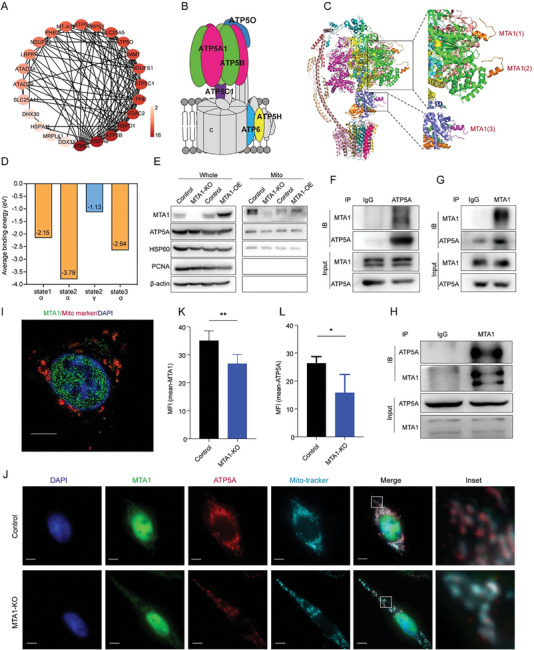
MTA1 interacts with ATP5A. A) Interaction network of 24 mitochondria‐associated proteins that bind MTA1 identified by LC–MS/MS. The shade of color indicates the number of proteins interacting with that protein. B) Schematic of the distribution of MTA1‐binding proteins, which are highlighted with different colors on ATP synthase. C) Simulation of the interaction between amino acids 670‐695 of MTA1 and ATP synthase in state 2. Binding sites are indicated by black boxes and magnified. MTA1 peptides are shown in orange (top) and pink (bottom). The ATP synthase α subunit is shown in green. The ATP synthase γ subunit is shown in purple. D) Average binding energy of the interaction between MTA1 peptides and ATP synthase subunits determined by simulated electron diffraction patterns (eV). E) Western blot analysis of MTA1 and ATP5A levels in mitochondria in MTA1‐KO cells and MTA1‐OE cells. F,G) Co‐IPs of MTA1 (F) and ATP5A (G) in HCT116 cells. H) Analysis of the binding between MTA1 and ATP5A in HCT8 cells by Co‐IP. I,J) The colocalization of MTA1 and ATP5A in mitochondria in HCT116 parent cells (I) and MTA1‐KO HCT116 cells (J) was visualized by immunofluorescence. Scale bar: 5 µm. K,L) Quantification of immunofluorescence. The values are the mean ± SD (**p < 0.01, *p < 0.05), Student's t‐test, n = 4 replicate/group.
