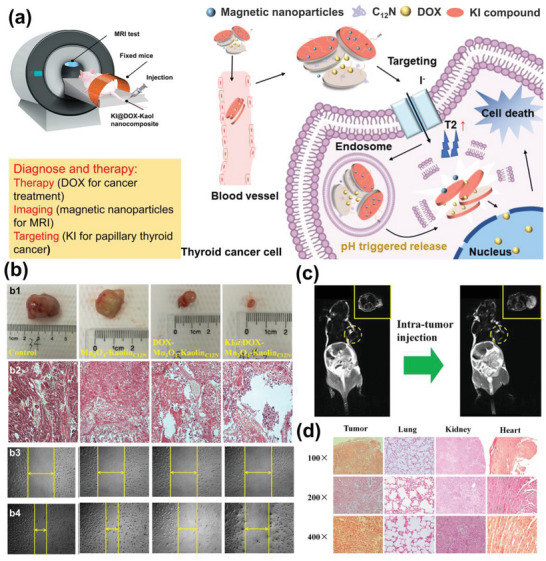
Figure 13.

a) Schematic diagram of KI@DOX‐Mn3O4‐KaolC12N. b) Digital photos (b1) and tumor‐volume change and microscopic images (b2) of tumor sections of tumor‐bearing nude mice after the implantation and antimetastasis assay results (b3,b4) of control, Mn3O4‐KaolC12N, DOX‐Mn3O4‐KaolC12N, and KI@DOX‐Mn3O4‐KaolC12N. c) In vivo imaging before and after (0 and 5 min, respectively) intra‐tumor administration of KI@DOX‐Mn3O4‐KaolC12N (top‐right corner shows magnified images of corresponding circled area). d) Microscopic sectional images and biodistribution of KI@DOX‐Mn3O4‐KaolC12N in tumor and main tissues. Reproduced with permission.[ 81 ] Copyright 2019, Springer.
