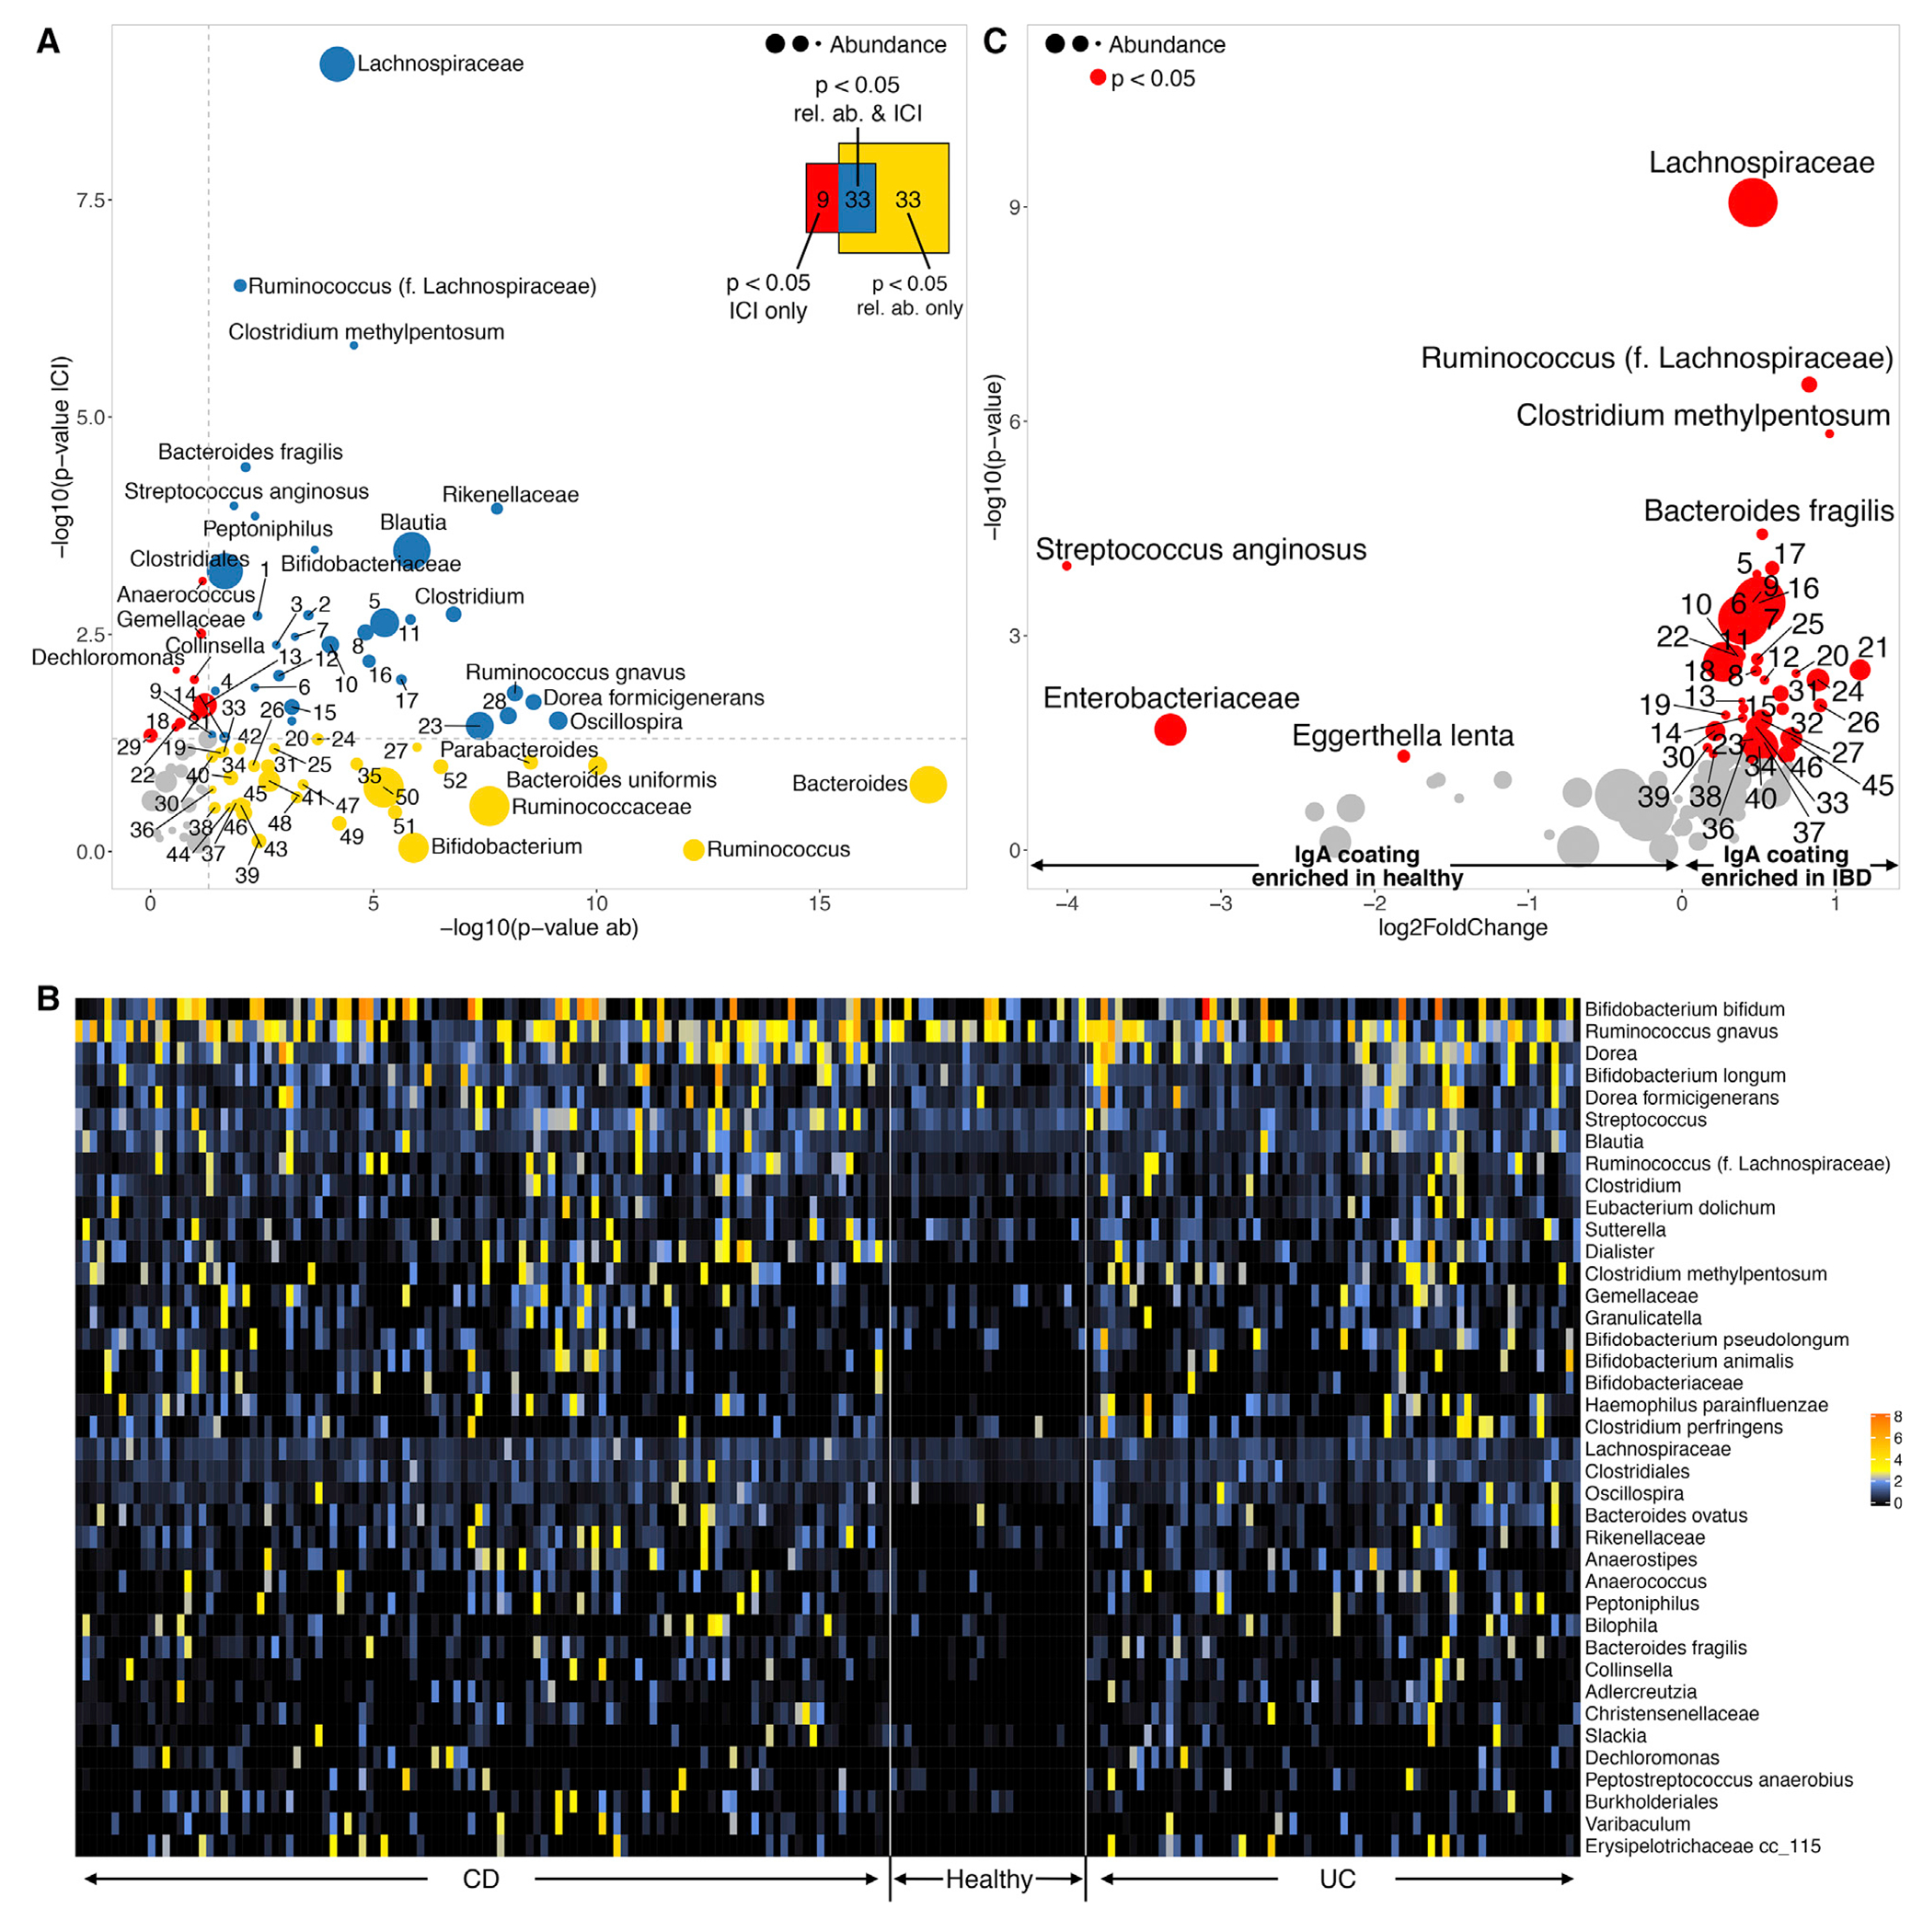
Figure 2. Differential Enrichment of IgA Coating and Relative Abundance in IBD-associated Taxa.

(A) Taxa differentially enriched in healthy (N = 27) or IBD (N = 180) subjects estimated using their relative abundance (horizontal axis: −log10 p value ofthe test) or IgA coating (vertical axis). Mean relative abundance is indicated by the size of the circles representing each taxa. Colors represent significantly differential taxa based on relative abundance (yellow), IgA coating (red), or both (blue). Venn diagram indicating the total number of taxa enriched as measured by abundance, IgA coating, or both. Numbers are exact, the area of the diagrams is not necessarily proportional.
(B) Heatmap of IgA Coating Index (ICI) scores in the 43 taxa with differential IgA coating between healthy (N=27) and IBD (N = 180) subjects.
(C) Volcano plot depicting taxa with differential IgA coating between healthy (N = 27) and IBD (N = 180) subjects. Horizontal axis indicates the fold change in ICI score (negative, enriched in healthy; positive, enriched in IBD). Vertical axis reflects −log10 p value of the test. The size of the circles indicates mean relative abundance, significant taxa (p < 0.05) colored in red. To improve legibility, some taxa have been replaced by numeric IDs (Table S4).
