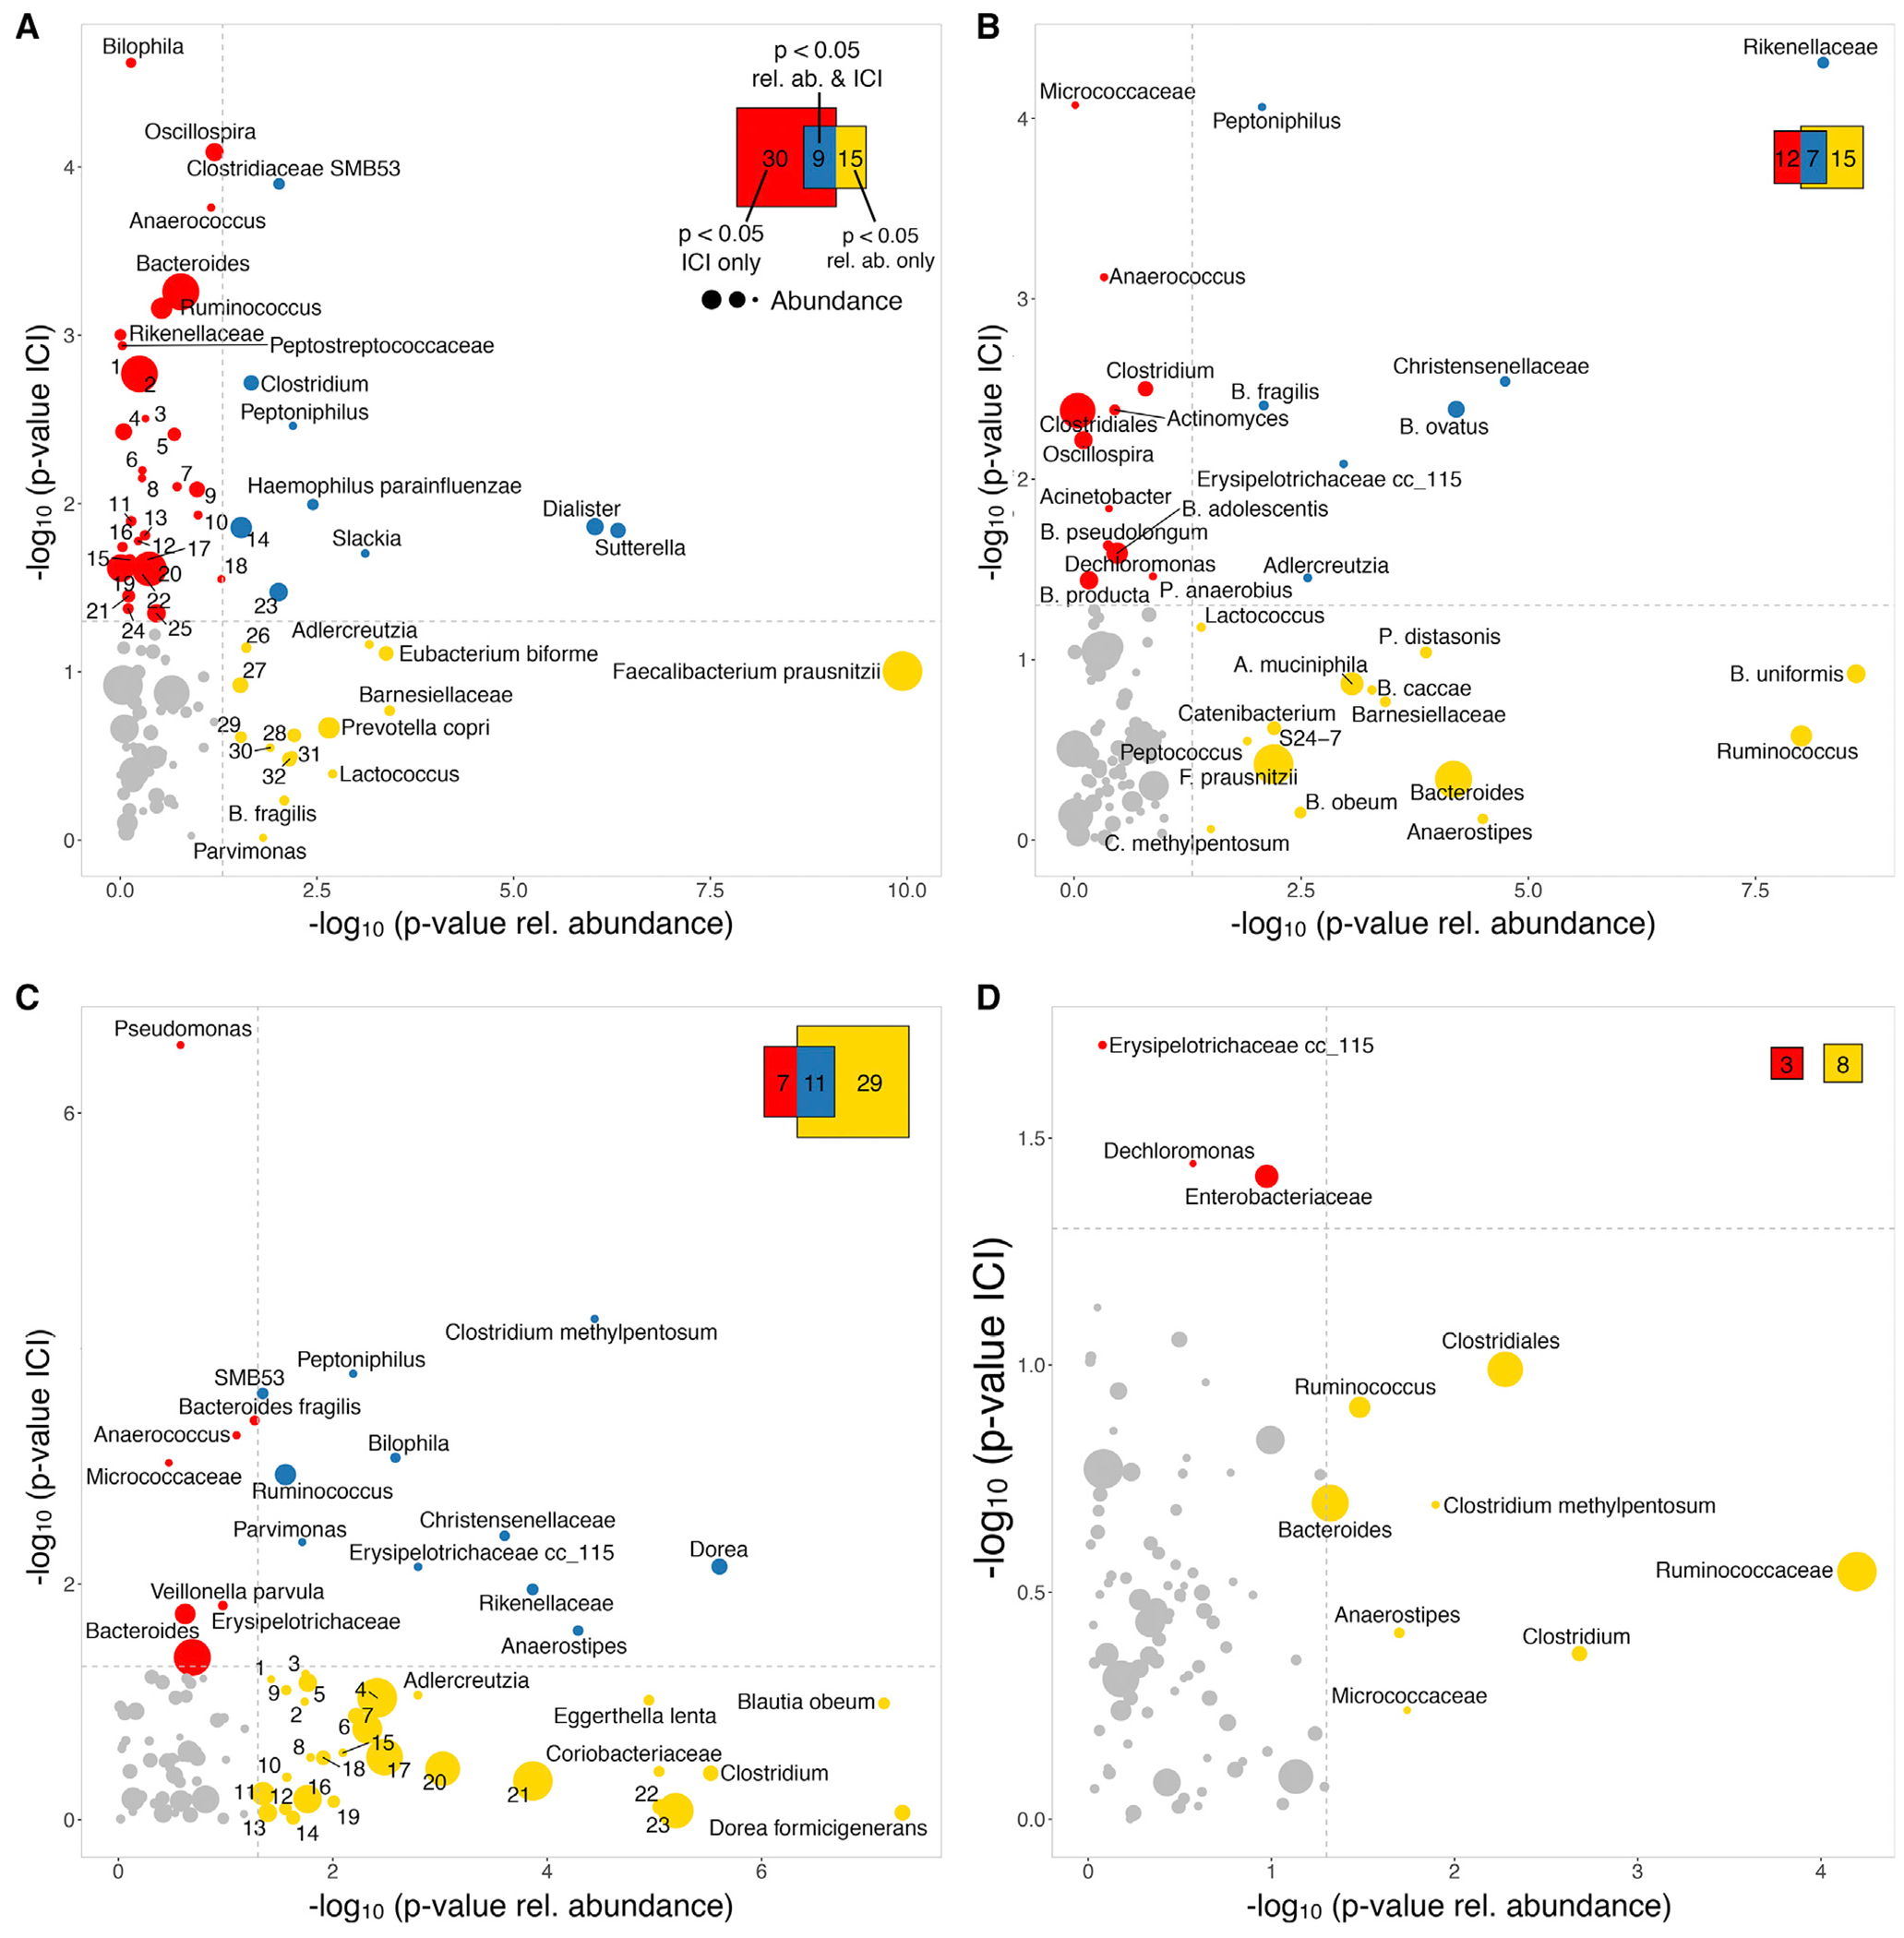
Figure 3. Impact of Medications on Relative Abundance and IgA Coating.

Taxa differentially enriched in subjects depending on whether they received a specific medication or not. Significance was estimated using their relative abundance (horizontal axis: −log10 p value ofthe test) or IgA coating (vertical axis). Mean relative abundance is indicated by the size of the circles representing each taxa. Colors represent significantly differential taxa based on relative abundance (yellow), IgA coating (red), or both (blue). Venn diagram shows the total number of taxa enriched as measured by abundance, IgA coating, or both.
(A) Biologics (untreated N = 173; treated N = 6). To improve legibility, some taxa have been replaced by numeric IDs (Table S4).
(B) Immune modulators (untreated N = 169; treated N = 10).
(C) Antibiotics (N = 154, N = 26). To improve legibility, some taxa have been replaced by numeric IDs (Table S4).
(D) Steroids (untreated N = 105; treated N = 74).
