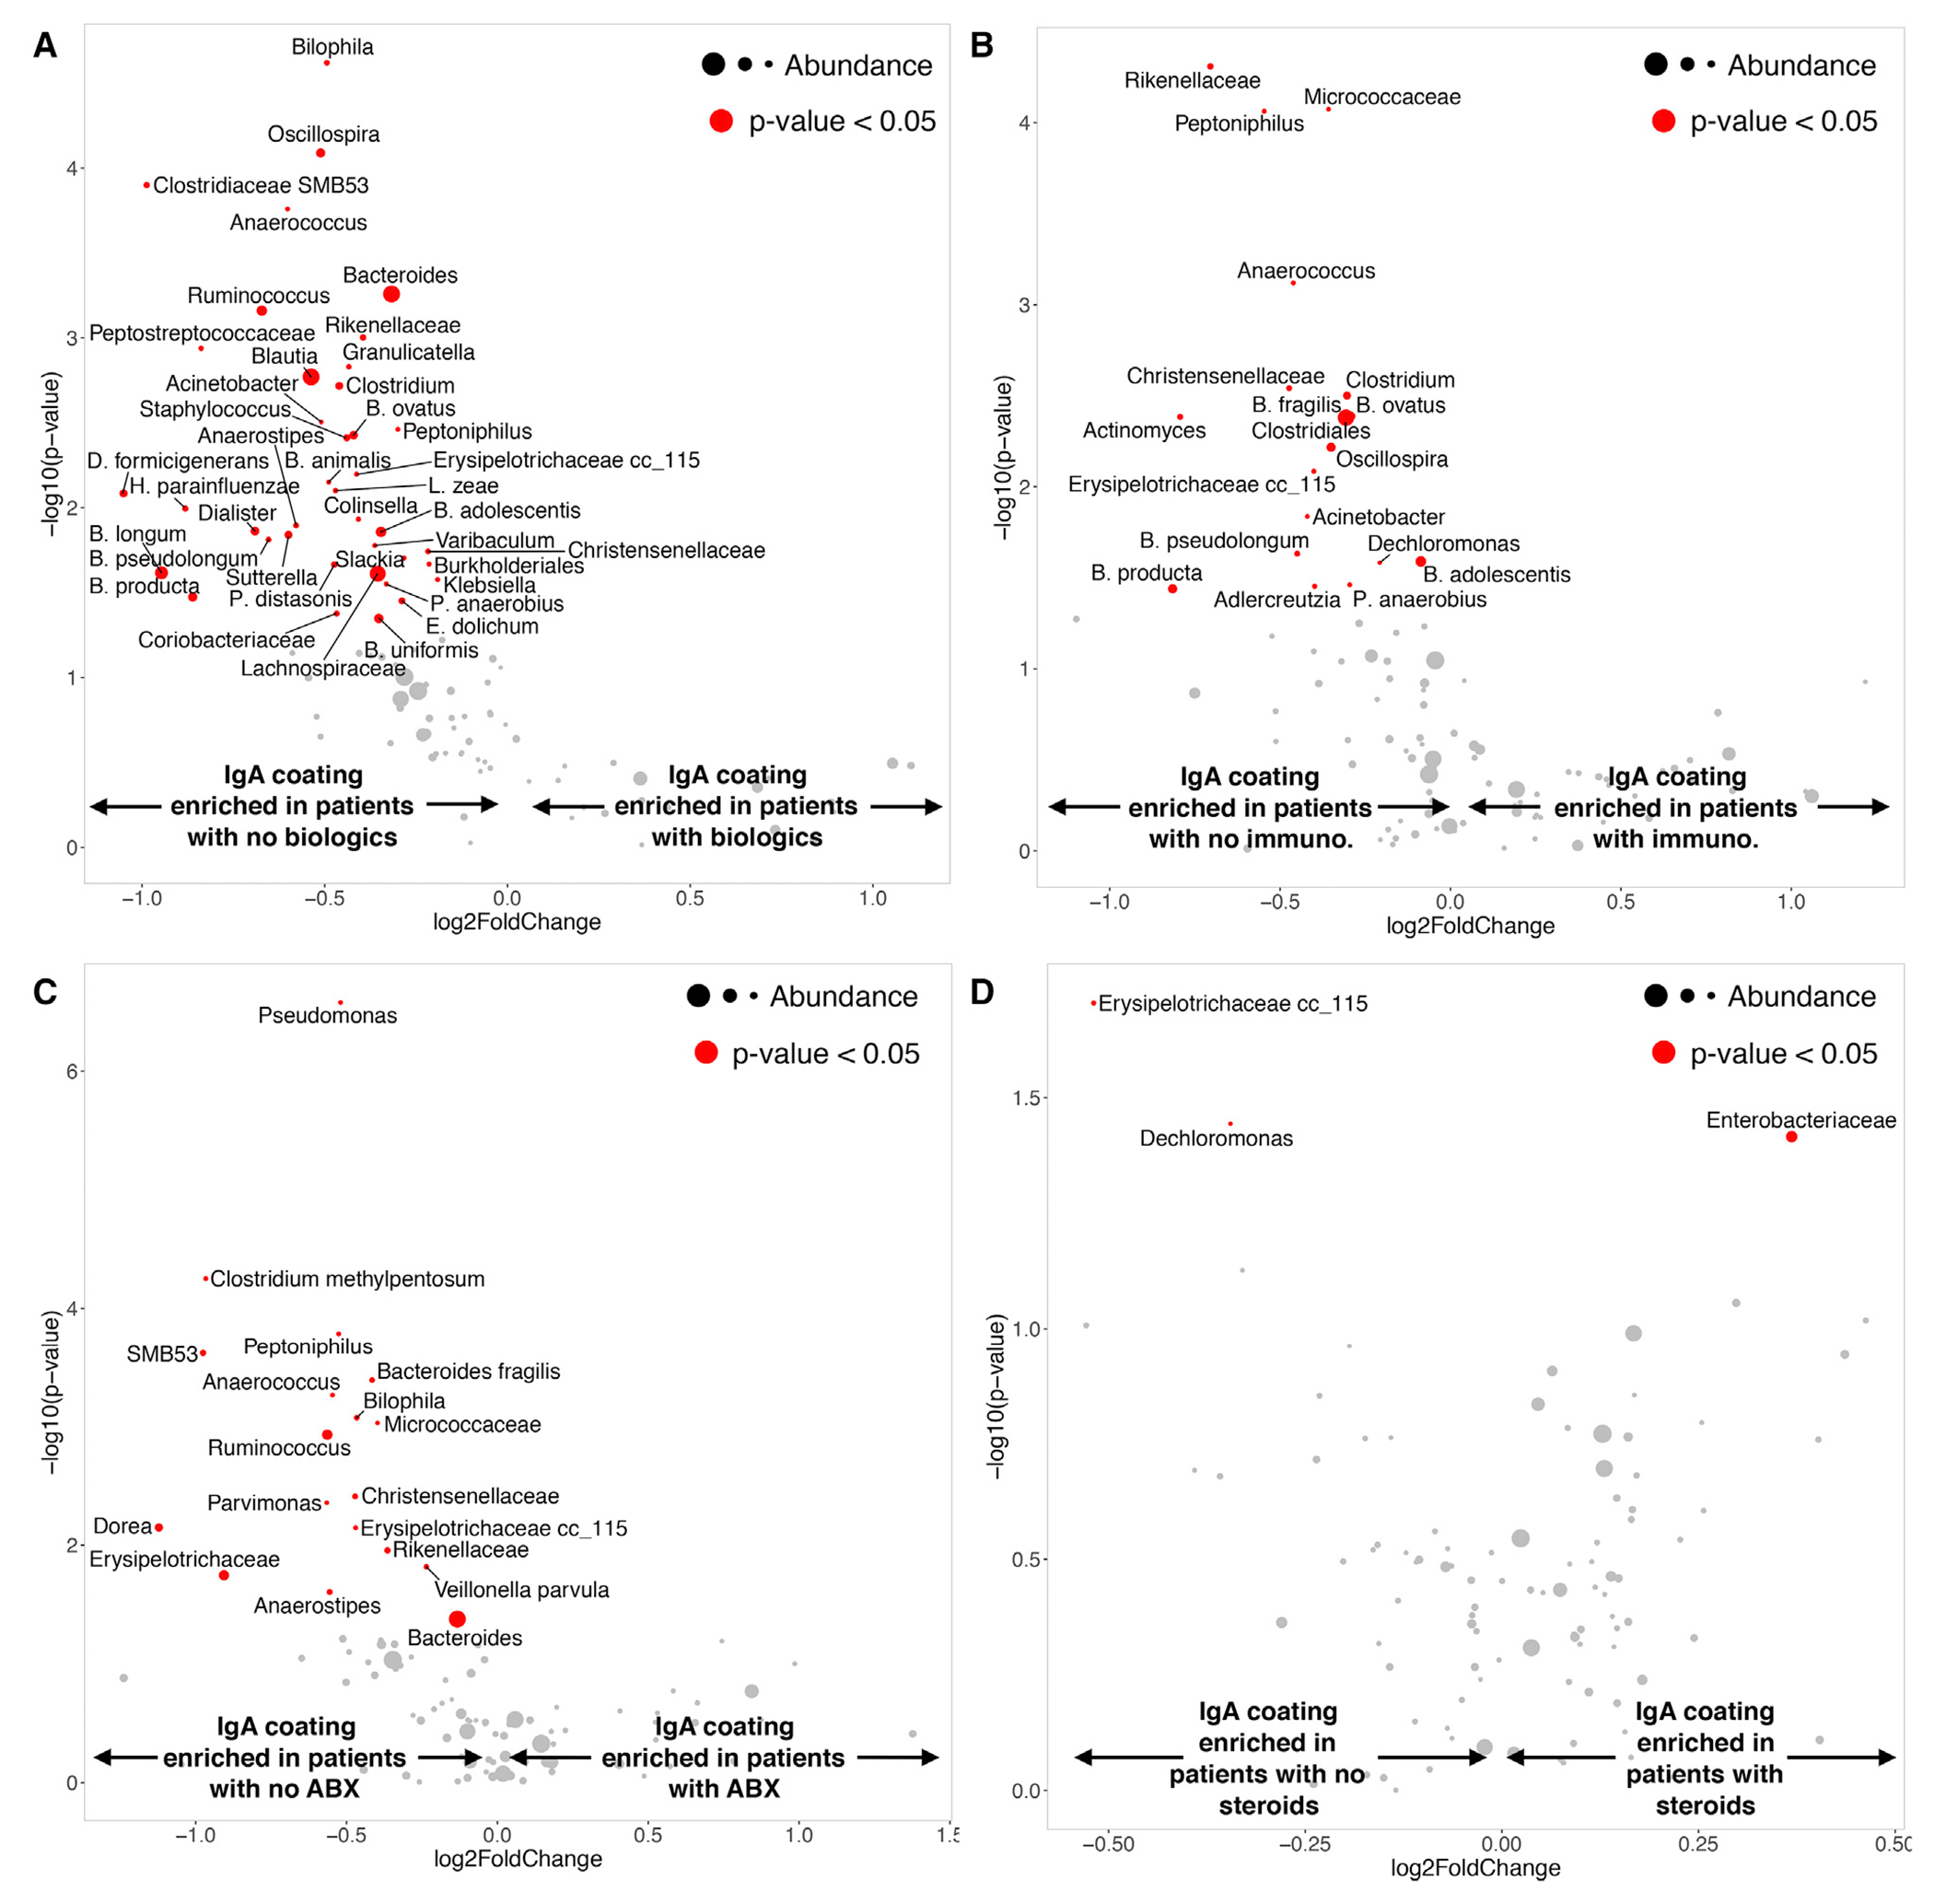
Figure 4. Medications Induce Differential Enrichment of IgA Coating.

Volcano plot depicting taxa with differential IgA coating between subjects receiving or not receiving specific medication. Horizontal axis indicates the fold change in ICI score (negative: enriched in healthy; positive: enriched in IBD). The vertical axis reflects −log10 p value of the test. Size of the circles indicate mean relative abundance, significant taxa (p < 0.05) colored in red.
(A) Biologics (untreated N = 173; treated N = 6).
(B) Immune modulators (untreated N = 169; treated N = 10).
(C) Antibiotics (N = 154, N = 26).
(D) Steroids (untreated N = 105; treated N = 74).
