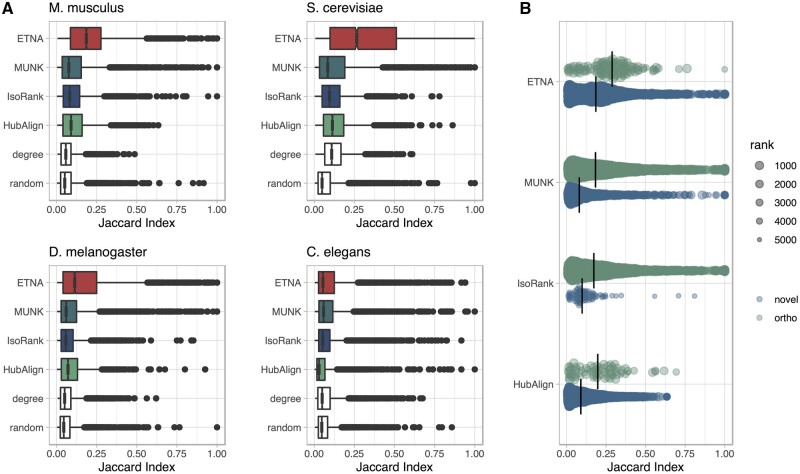
Figure 2.
Jaccard index for top 5000 aligned pairs. (A) Box plots for top 5000 gene pairs for H.sapiens and four model organisms (M. musculus, S. cerevisiae, D. melanogaster, C. elegans). Four methods (ETNA, MUNK, HubAlign, IsoRank) and two baselines (degree and random) are compared. ETNA has the best performance in M. musculus (P < 10–16), S. cerevisiae (P < 10–16), D. melanogaster (P < 10–16), and comparable performance to MUNK in C.elegans, demonstrating how ETNA’s joint embedding captures multi-functional similarity. All P-values reported are from Wilcoxon rank-sum test (Conover 1999) to the second best method. (B) Jaccard index comparison between orthologous (ortho) pairs (in green, top) and nonorthologous (novel) pairs (in blue, bottom) within top 5000 pairs of H. sapiens–M. musculus alignment. ETNA is better at prioritizing gene pairs beyond orthologs.

