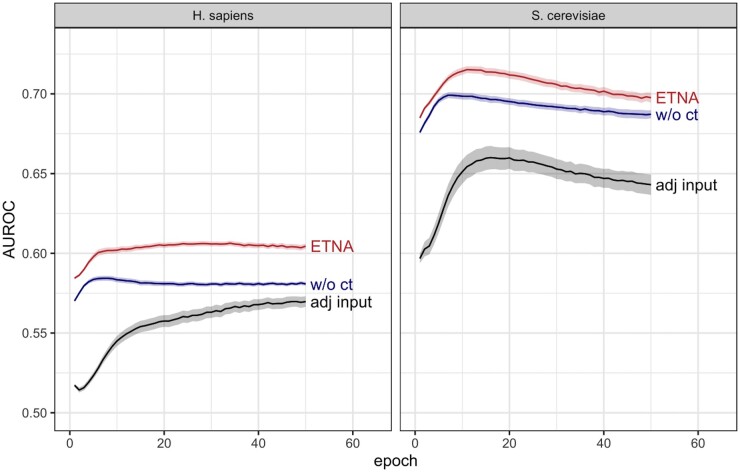
Figure 3.
Predicting functional similarity using individual network embeddings in H. sapiens and S. cerevisiae with ETNA (red), embeddings without cross-training (blue, ‘w/o ct’), and using the adjacency matrix as input (black, ‘adj input’). Lines show mean AUROC across 100 random sets of hyperparameters, and ribbons denote the 95% confidence interval for predicting functional similarity [defined based on co-annotation to the same GO term for all terms in the gold standard (Section 2.3)]. Cross-training and using the NetMF matrix instead of the adjacency matrix as input both lead to significant improvements to ETNA’s predictive performance.

