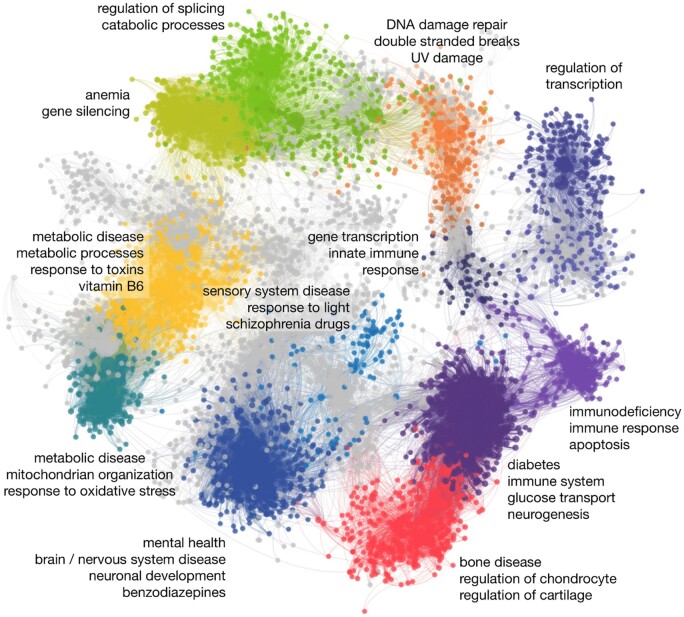
Figure 5.
Network of the top gene mappings between human and mouse. This network shows the top 1% of ETNA scores for the alignment of H. sapiens and M. musculus, where each vertex is a gene and each edge is an alignment between the two species. Enrichment of disease, drug, and GO terms were calculated for each cluster, and selected enriched clusters are colored and labeled here with significant terms summarized, highlighting the potential for ETNA to discover novel biology. Clusters with similar colors have shared functions.

