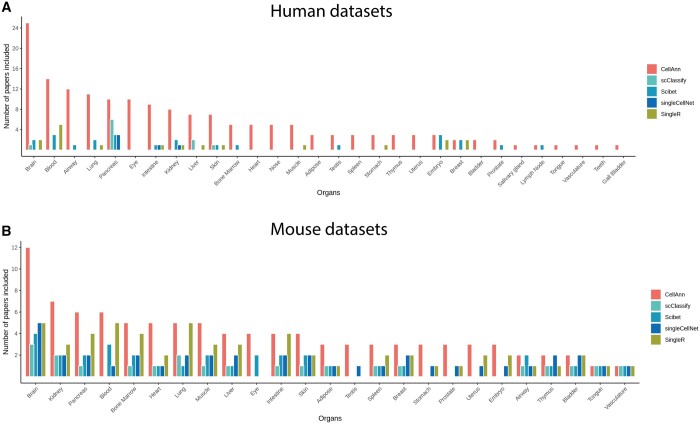
Figure 3.
Reference datasets included in CellAnn. The bar plot compares the available datasets for each organ type in human (A) and mouse (B) included in the CellAnn database and other reference-based cell annotation web services. The x-axis represents different organs, and the y-axis represents the number of papers related to the corresponding organs.

