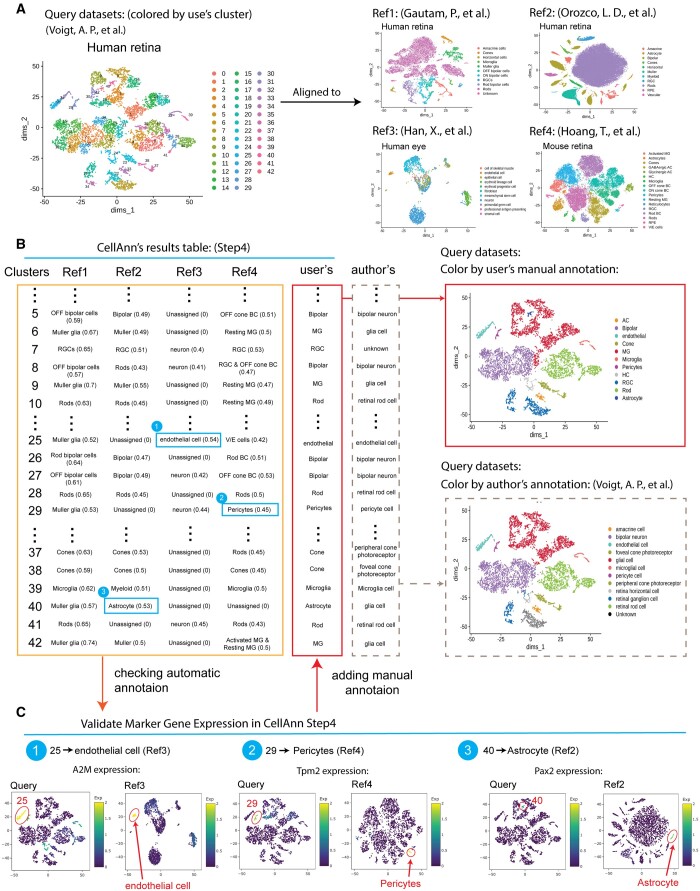
Figure 5.
A case study on cell type annotation with multiple references using CellAnn. (A) The UMAP plots show the query data and four different reference datasets. The cells in the query data are colored by clusters, and the cells in the reference datasets are colored based on the author's cell type annotation. (B) The comparisons of alignment results by CellAnn with the author's annotation in the query datasets. The left panel displays a table that shows the predicted cell type labels by CellAnn. The right panel displays UMAP plots of the query datasets, with the predicted annotation and the author's original annotation. (C) The marker gene expression levels in both query and reference datasets, help the users to select the cell type when the results from multiple reference datasets are inconsistent.

