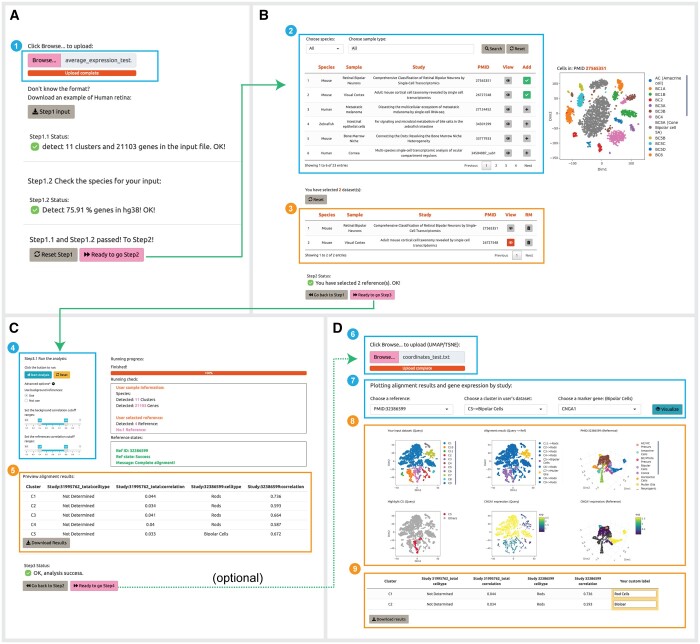
Figure 6.
Example webpages associated with each step of the analysis. (A) Step 1: a window for uploading expression profiles of query data (1). (B) Step 2: a table for searching and selecting datasets in CellAnn (2), and a table for reviewing the selected datasets (3). (C) Step 3: a window for running CellAnn and tuning parameters (4). a table for downloading predicted cell types (5). (D) Step 4: a window for uploading coordinate profiles (6), a search window for alignment results and related marker genes (7), UMAPs for query and reference data that are colored by cluster, predicted cell type, author's annotation (for reference), and gene expression values (8), and a downloadable and editable table that users can review to see predictions and add their own custom annotations (9).

