
Figure 1: Descriptive demographics, environmental exposures and adenoma characteristics within the GIDER cohort.
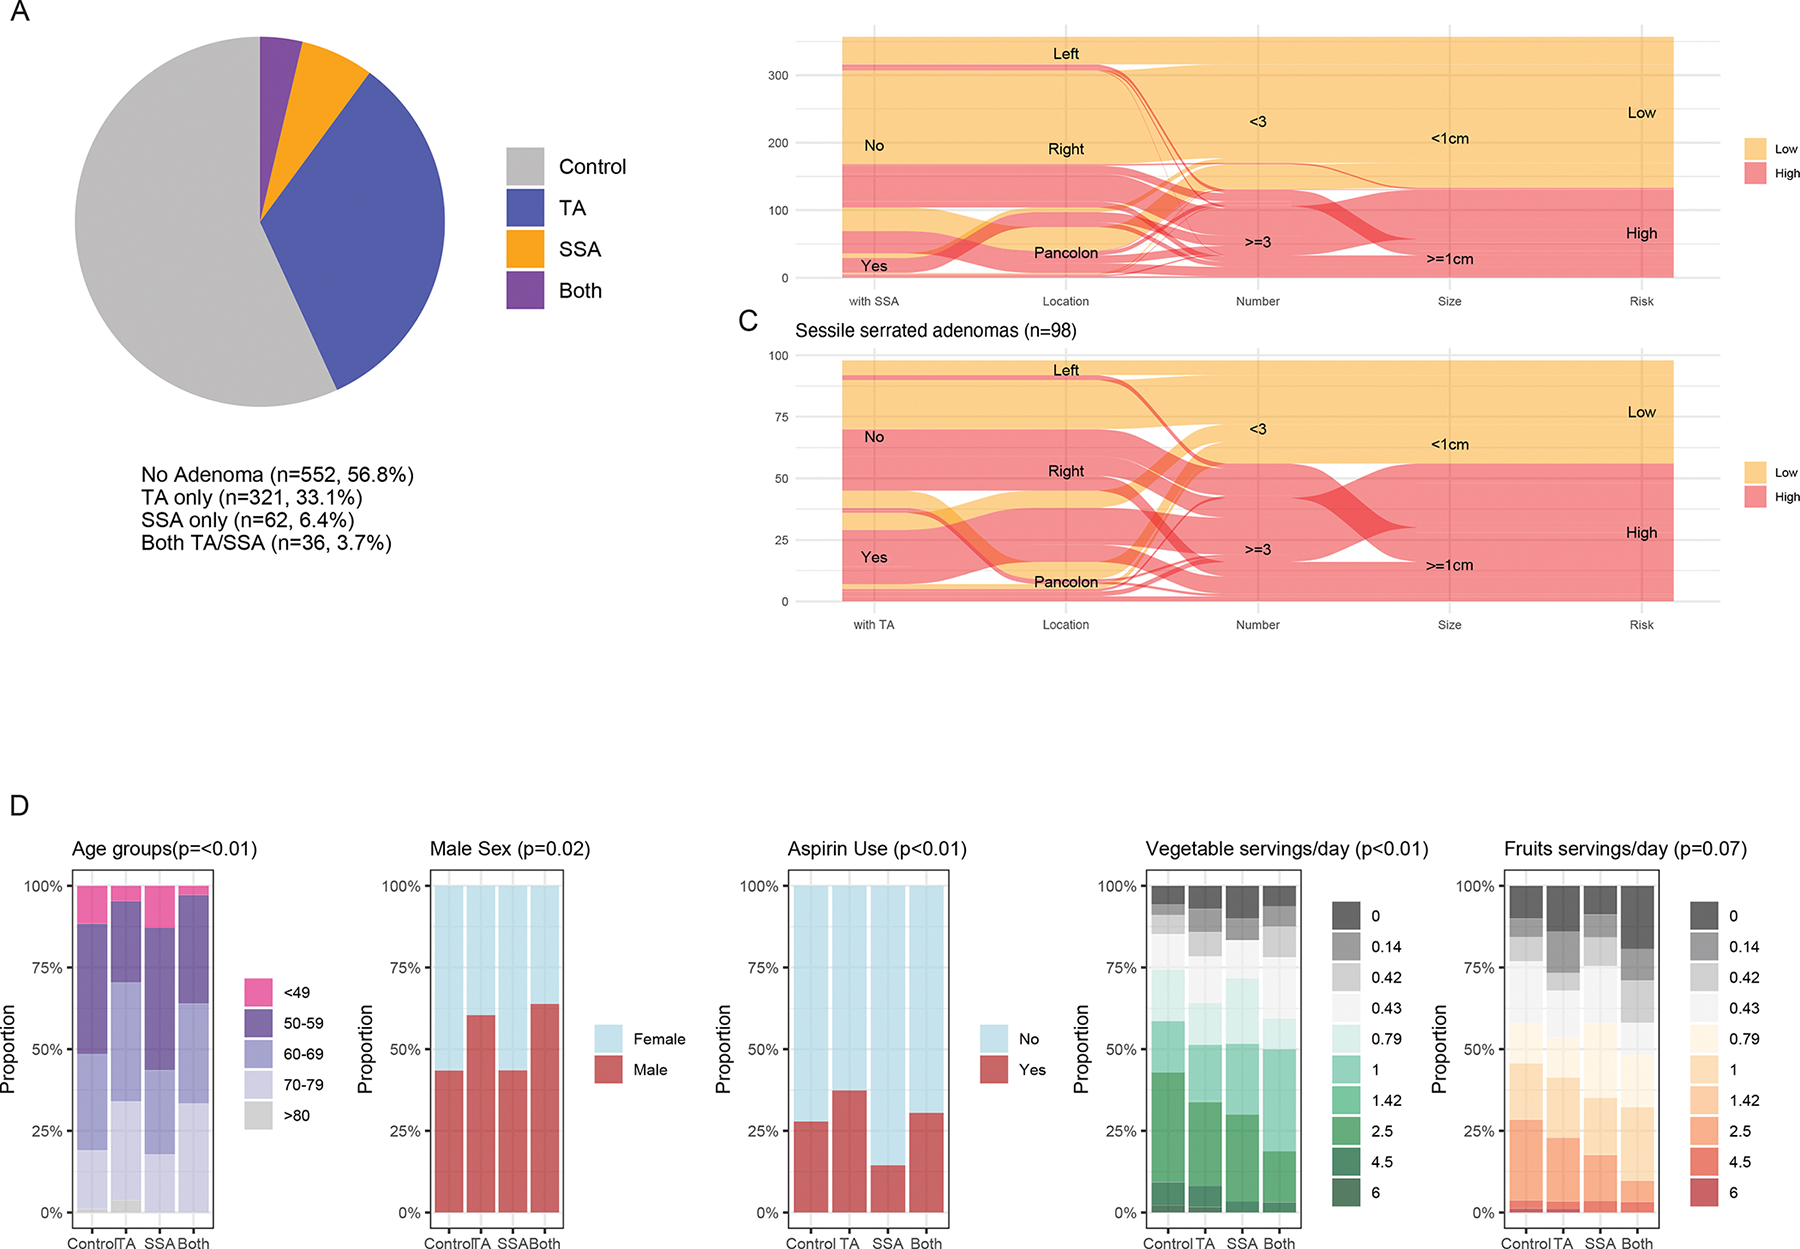
(A) Pie chart of the 917 participants within GIDER, grouped by their adenoma histological subtypes (i.e., no adenoma, serrated adenomas, tubular adenomas). (B, C) Number of patients with TA or SSA risk stratified as mid- or high-clinical risk depending on the total number of adenomas and size. (D) Significant demographic factors and environmental exposure differences between SSA and TA - participants with TA were of older age, more likely to be male, more likely to use aspirin, and self-reported higher daily servings of vegetables and lower daily servings of processed meat.