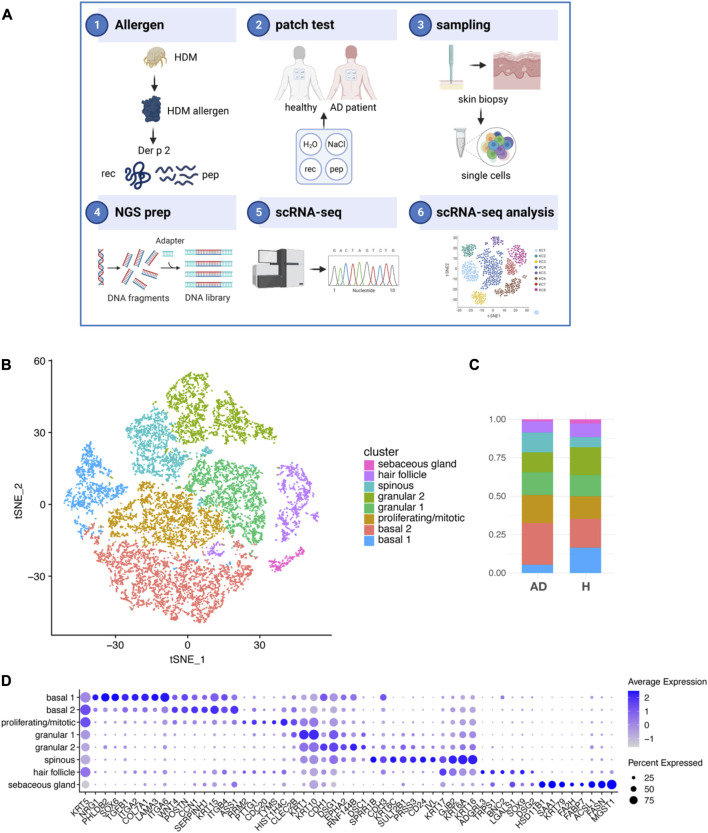
FIGURE 1.
Keratinocyte subsets from AD and H after exposure to HDM allergens. (A) Schematic outline of the study strategy: 1) the recombinant HDM allergen Der p 2 (Der p 2 rec), a mix of five hypoallergenic Der p 2 peptides (Der p 2 pep) and negative controls were 2) applied onto the non-lesional back skin of four non-sensitized participants without AD (healthy) and four HDM sensitized participants with AD using patch tests. 3) Biopsies of Der p 2 rec- and pep-treated skin were taken after 72 h, and single cells were produced by the digestion of whole skin tissue. 4) NGS libraries were prepared and 5) sequenced using scRNA-seq technology. 6) Sequencing data from 16 skin samples were processed and KC analyzed. (B) tSNE plot showing eight different KC clusters from the merged dataset comprising 16 skin biopsies (4x AD and 4x H, each 1x rec and 1x pep; summing up to 52,975 KC in total). (C) Bar charts showing the relative abundance of KC subsets within AD and H samples (n = 8 biopsies for AD and H). (D) Bubble plot shows the expression of cluster specific markers (x-axis) for KC subsets (y-axis). The average expression is represented by blue values (low expression, light blue; high expression, dark blue). The percentage of cells expressing the respective marker is represented by the size of the circles. AD, atopic dermatitis; H, healthy; HDM, house dust mite; KC, keratinocyte; scRNA-seq, single-cell RNA sequencing; rec, recombinant; pep, peptide; tSNE, t-distributed stochastic neighbor embedding.

