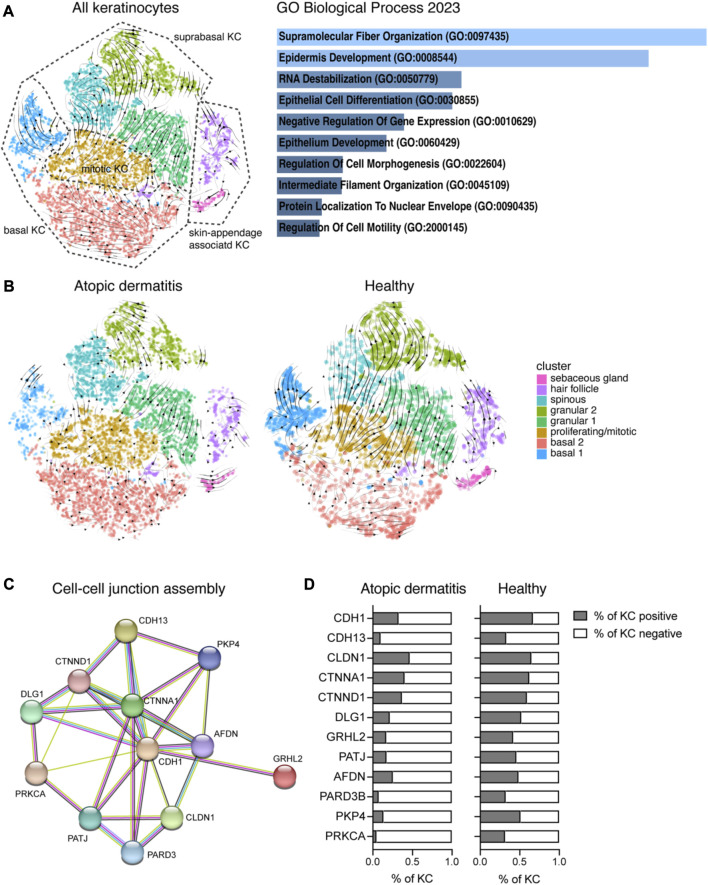
FIGURE 2.
Analysis of the ratio between unspliced and spliced mRNAs reveals AD-specific disturbances in KC differentiation. (A) Left: RNA velocity vectors were projected on the tSNE plot from Figure 1B showing KC clusters of the whole dataset (cells from 16 biopsies, AD and H). Right: 140 genes that were driving RNA dynamics were analyzed using Enrichr (Chen et al., 2013). The bar graph shows gene set enrichments in the GO biological process 2023 database (sorted by p-value ranking). (B) RNA velocity vector projections are shown for KC from treated AD (left) and H (right) skin. (C) Functional enrichment analysis identified cell–cell junction perturbations in AD. Downregulated genes in AD were analyzed using the STRING network database The network view of gene names (circles) and their predicted associations (lines) is shown. (D) Percentage of KC from AD and H skin expressing genes listed in (C) (eight biopsies per group). AD, atopic dermatitis; H, healthy; KC, keratinocyte; tSNE, t-distributed stochastic neighbor embedding.

