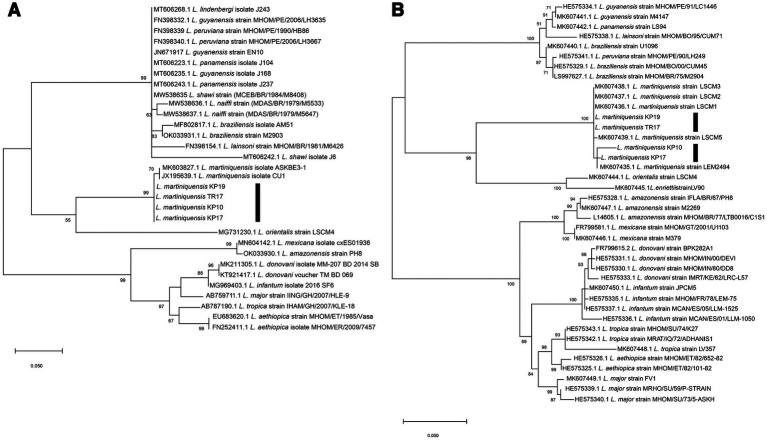
Figure 2.
(A) Maximum Likelihood tree based on ITS1 sequences of Leishmania spp. (B) Maximum Likelihood tree based on 3’UTR-HSP70-I sequences of Leishmania spp. Bootstrap values are shown at each node. Bootstrap values of ≥70% correspond to supported clades. Nodes with Bootstrap values of <50% are not shown.

