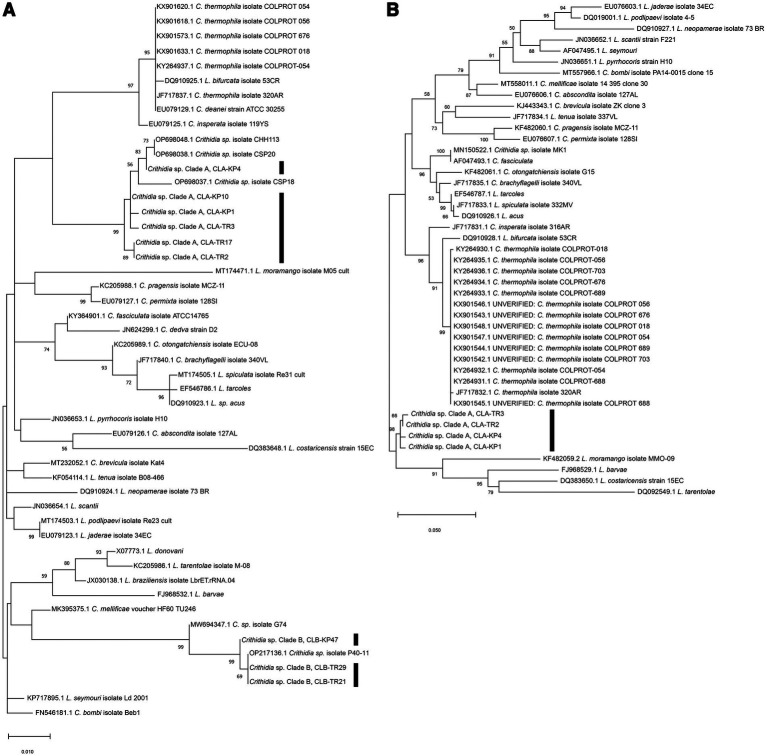
Figure 3.
(A) Maximum Likelihood tree based on SSU rRNA sequences of Crithidia spp., Leishmania spp. and Leptomonas spp. (B) Maximum Likelihood tree based on gGAPDH sequences of Crithidia spp., Leishmania spp., and Leptomonas spp. Bootstrap values are shown at each node. Bootstrap values of ≥70% correspond to supported clades. Nodes with Bootstrap values of <50% are not shown.

