Abstract
Blockade of the T cell exhaustion marker PD-1 to re-energize the immune response is emerging as a promising cancer treatment. Relapse of hematological malignancy after allogeneic stem cell transplantation (allo-SCT) limits the success of this approach and PD-1 blockade may hold therapeutic promise. However, PD-1 expression and its relationship with post-transplant relapse is poorly described. Since the donor immunity is activated by allo-responses, PD-1 expression may differ from non-transplanted individuals and PD-1 blockade could risk graft-versus-host disease. Here we analyzed T-cell exhaustion marker kinetics and their relationship with leukemia relapse in 85 patients undergoing myeloablative T-cell depleted HLA matched SCT. At a median follow up of 3.5 years, 35 (44%) patients relapsed. PD-1 expression in CD4 and CD8 T-cells was comparably elevated in relapsed and non-relapsed cohorts. Helios+ regulatory T cells and CD8 effector memory cells at day 30 emerged as independent predictors of relapse. Although leukemia antigen specific T-cells did not overexpress PD-1, single cell analysis revealed LAG3 and TIM3 overexpression at relapse. These findings indicate that PD-1 is an unreliable marker for leukemia-specific T cell exhaustion in relapsing patients but implies other exhaustion markers and suppressor cells as relapse biomarkers.
Keywords: Post-transplant relapse, Biomarker, Graft versus leukemia effect
INTRODUCTION:
Relapse of primary disease is a major obstacle to successful allogeneic stem cell transplantation (allo-SCT) in hematologic malignancies.1–3 The mechanisms underlying post-transplant relapse are multifactorial and incompletely understood,4,5 but failure of the graft versus leukemia (GVL) effect may contribute to post-transplant relapse.6 There is a growing interest in PD-1 and other T cell immune check-point markers as therapeutic targets for hematologic malignancies.7 Early phase trials showed immune checkpoint inhibitors can induce clinical responses in selected cases of post-transplant relapse.8,9 In allo-SCT, however, the immune check point inhibitors can also induce severe, steroid-refractory graft versus host disease (GVHD) through activation of diverse alloreactive T cell population irrespective of their contribution to GVHD or GVL.9 Therefore, understanding PD-1 kinetics and its relationship to relapse is desirable before using check point inhibitors to prevent or treat relapse after allo-SCT.
Here we evaluated the relationship between the kinetics of T-cell check-point markers and leukemia relapse in the early post-transplant period. We further analyzed the leukemia associated antigen (LAA) specific T-cells and T cell exhaustion markers at relapse and sought to define the status of donor T cells at relapse at the single cell level.
METHODS:
Clinical study design
Eighty-five patients with various hematologic malignancies received ex-vivo T-cell depleted HLA matched related sibling allo-SCT at a single center between 2006 and 2015. All patients signed an informed consent prior to enrollment and the study was conducted in compliance with the Declaration of Helsinki under the protocols approved by the Institutional Review Board of the National Heart, Lung, and Blood Institute (Clinicaltrial.gov ID: NCT00378534, NCT01517035, and NCT01866839). All subjects received a myeloablative conditioning regimen of cyclophosphamide, fludarabine, and total body irradiation (600 to 1200cGy) with GVHD prophylaxis of low-dose cyclosporine until day 21 (target trough level between 100–200 ng/ml). Peripheral blood stem cells (PBSCs) with G-CSF mobilization were used as a graft source and ex-vivo T-cell depletion was performed either by CD3+/CD19+ cell depletion (n=20) or CD34+ cell selection (n=65) using Miltenyi CliniMACS® magnetic selection system. Donor lymphocyte infusions (DLIs) were administered for seven subjects who developed late-onset graft failure before day 100. Since DLIs can affect the immune reconstitution, these seven patients were excluded from clinical correlation analysis. Median percentages of CD3 T cell chimerism were 91% at day 30, 98% at day 60, and 99% at day 100 respectively.
Laboratory study design
Sample collections and storage
Peripheral blood was collected from the donors, and from the recipients, pre-transplant, at days 30, 60, and 100 following allo-SCT. Additional blood was collected around the time of relapse from relapsing patients. Peripheral blood mononuclear cells (PBMCs) were isolated by Ficoll-Hypaque density gradient centrifugation and cryopreserved in liquid nitrogen until further use.
Flow cytometry phenotype analysis
Multicolor flow cytometric analysis was performed to characterize T cell subsets, memory T cells, helper T cells, regulatory T cells (Tregs) with T cell check point markers (PD-1, TIM-3, and LAG3). Briefly, the cells were first stained with fixable violet live-dead dye (Vivid, Invitrogen, NY, USA) for 15 minutes, followed by staining for chemokine receptor at 37°C and other cell surface markers for 15 min at room temperature. For intracellular staining, the cells were further permeabilized using Foxp3 fixation/permeabilization buffer (eBioscience, San Diego, CA, USA) for 30 minutes in 4°C followed by 30 min incubation with intra-cellular antigen antibodies at room temperature. T cell memory subsets were determined within either CD4 or CD8 T cell population to identify naïve cells (CCR7+CD45RO−), central memory cells (CCR7+CD45RO+), effector memory cells (CCR7−CD45RO−), and effector memory RA (TEMRA; CCR7−CD45RO−CD27−CD45RA+). PD-1 positive cell population were determined within CD4 population based on fluorescence minus one (FMO) control. Regulatory T cell subsets were identified within CD4 T cell population based on the expression of two transcription factors, FoxP3 and Helios. Antibodies used in the flow cytometry experiment were summarized in Supplementary Table 1 and the gating strategy of flow cytometry was summarized in Supplementary Figure 1. The data acquisition was performed using a Becton Dickinson LSRII Fortessa and analyzed using FlowJo software (Tree Star Inc. Ashland OR). At least 20,000 events per CD3+T cell population were acquired on a Becton Dickinson LSRII Fortessa cytometer (BD Biosciences, CA, USA) to ensure sufficient number of cells for statistical analysis. Data was analyzed using FlowJo software version 10 (Tree Star Inc., Ashland, OR, USA).
Antigen specific T cell detection
Virus and leukemia-associated antigen peptides
Pooled PepMix HIV-1 (Con B gag motif, JPT, Berlin, Germany) was used as a negative control antigen and OKT3(anti-human CD3, functional grade purified, eBioscience) was used as positive control for both ELSPOT and flow cytometry-based antigen specific T cell assay. The following peptides were used as target antigens: cytomegalovirus (PepMix™ HCMVA, pp65, JPT, Berlin, Germany), PRAME (PepMix™ Human Prame/OIP4, JPT, Berlin Germany), MAGEA3 (Pepmix™ Human MAGEA3, JPT, Berlin, Germany), NYESO (PepMix™ Human NY-ESO-1, JPT, Berlin, Germany), WT1(PepTivator® WT1 – premium grade Miltenyi Biotec, Bergisch Gladbach, Germany), and Aurora kinase (Custom-made PepTrack-Peptide Libraries, JPT, Berlin, Germany).
ELISPOT assay
ELISPOT was performed using the human IFNγ/TNF-α/IL-2 Three-Color Fluorospot kit (Cellular Technology Limited, Cleveland, OH, USA) under the guidance of the manufacturer’s instruction. After thawing PBMC in serum free AIM-V medium, the cells were plated at 200,000 cells per well in duplicates. Then cells were stimulated with peptides at a concentration of 1μg/m without any additional antigen presenting cells and incubated at 37 °C 5% CO2 for 20 hours. The plates were scanned using ImmunoSpot Series 6 Analyzer (CTL, Shaker Heights, OH, USA) and analyzed using Immunospot 6.0 software (CTL, Shaker Heights, OH, USA) with either basic count or smart count mode and gating was auto-adjusted depending on positive control wells and negative control wells.
Flow cytometry
PBMC were thawed in serum free AIM-V medium, washed and cultured with individual peptides in. In a 96 well-round bottom cell plate, 2×10⁵cells (50uL) were stimulated with each individual peptide (1μg/mL;50uL) in the presence of co stimulatory anti-human CD28 (clone CD28.2), anti-human CD49d (clone 9F10) and protein transport inhibitor golgi stop (BD bioscience Cat-51–2092KZ), golgi plug (BD bioscience Cat-51–2301KZ) and AIM-V medium. The plate was incubated at 37 °C in a humidified incubator maintained at 5% CO2 for 6 hours. Following 6-hour incubation period, the plates were stained with fixable violet live-dead dye (Vivid, Invitrogen, NY, USA) for 15 minutes at 4°C s, followed by staining for chemokine receptor at 37 °C and then for cell surface markers for 15 min at room temperature. For intracellular staining, cells were fixed and permeabilized (BD Cytofix/Cytoperm Kit; BD Biosciences) for 45 minutes at 4°C in dark. After washing with Perm/Wash solution (BD Cytofix/Cytoperm Kit; BD Biosciences), cells were stained intracellularly with the antibodies in 50 ul Perm/ Wash buffer 30 min at room temperature in the dark. Stained cells were acquired on a Becton Dickinson LSRII Fortessa cytometer (BD Biosciences, CA, USA) and data was analyzed using FlowJo software version 10 (Tree Star Inc., Ashland, OR, USA).
Leukemia associated antigen RT PCR
Relative changes in RNA expressions of leukemia associated antigens were evaluated by RT-PCR array. RNA was extracted from bulk peripheral blood using the All prep DNA/RNA Mini kit (Qiagen, Hilden, Germany) according to the manufacturer’s instructions. To synthesize cDNAs, 1μg of RNA was reverse transcribed using the iScript gDNA clear cDNA synthesis kit (Bio-Rad Laboratories, Hercules, CA, USA), according to manufacturer’s instruction. The RT-PCR reactions were performed using 5 ng cDNA and SsoAdvanced Universal SYBR green Supermix (Bio-Rad Laboratories, Hercules, CA, USA) in custom made 384 well plate PrimePCR™ Assay Panels for Real-Time PCR (8 target genes, Bio-Rad Laboratories, Hercules, CA, USA; Supplementary Table 2) in 7500 Real Time PCR system (Applied Biosystems, Foster City, CA, USA). The PCR was run for 2 min at 95°C for 1 cycle (activation), followed by 40 cycles of 95°C for 5 seconds (denaturation), 40 cycles of 60°C for 30 sec (annealing) and then, melt curve step of 65–95°C increment (5 sec per step) for 1 cycle. Glyceraldehyde 3-phosphate dehydrogenase (GAPDH), ABL1 and ACTB (Actin) were used as housekeeping genes.
Flow sorting of antigen-specific T cells
In a 24 well flat bottom plate,10 million cells/ml/well were stimulated for 6 hours with peptides libraries of PRAME or CMVpp65 in presence of co stimulatory CD28/CD49d. Following the 6-hour incubation, the cells were collected from each well and TNFα secretion assay was performed using Cell enrichment and Detection (PE) human kit (Miltenyi Biotec) per manufacturer’s instructions to detect PRAME or CMVpp65 specific T cells. Dead cells were excluded using fixable violet live-dead dye (Vivid, Invitrogen, NY, USA) by staining for 15 minutes at 4°C. The following antibody clones were used for staining: TNFα detection PE (MACS Miltenyi, provided with kit), CD3 BV605(Biolegend, clone 317322), CD14-CD19-Pacific Blue (Life technologies; Clone MHCD1428 and MHCD1928, respectively) as dump channel and acquired on flow for sorting. TNFα-positive and TNFα-negative population were sorted using FACS sorter ARIA II (BD Bioscience, San Jose, CA, USA).
Single Cell RNA-seq
Single cell 3’ digital gene expression profiling for CMVpp65 or PRAME specific T cells was performed via the 10x™ Chromium™ Single Cell Platform (10x Genomics, Pleasanton, CA USA) at targeted cell number of 5000 cells. Single cell RNA-seq libraries generation, GEM-RT, and cDNA amplification were performed according to manufacturer’s instructions and libraries were sequenced on Illumina Hiseq 3000.
Statistical analysis
The data from RT-PCR assays were analyzed with Prime PCR software (Bio-Rad Laboratories, Hercules, CA, USA). Cumulative incidences of relapse were estimated and compared by the Gray’s method, which adjusts for competing risks due to non-relapse mortality.10 Overall survival and post-relapse survival probabilities were estimated by the Kaplan-Meier method and compared between subgroups of patients by the log-rank test. Comparisons were carried out between patients who relapsed or did not relapse. For comparing categorical variables and continuous variables between relapsed and non-relapsed cohorts, Fisher’s exact test and Mann-Whitney test were used, respectively. Multivariate analysis based on the Cox proportional hazards regression was used to examine the risk factors for the cause-specific hazards of relapse controlling for pre-transplant characteristics. All tests were two-sided and P-values < 0.05 were considered statistically significant. Analysis were performed using the R statistical software, version 3.4.3 (R Foundation for Statistical Computing) and Graphs were generated using Prism 5.03 (GraphPad Software, Inc. La Jolla, CA, USA).
The Cell Ranger Single-Cell Software was used for sample demultiplexing, barcode processing, single-cell gene counting, and cell clustering. The Database for Annotation, Visualization, and Integrated Discovery (DAVID version 6.8; https://david.ncifcrf.gov/home.jsp)11 was used for Gene Ontology (GO) annotation analysis of Biological Process in the set of genes passing threshold (fold changes> 2.0 and P<0.05) in each cluster.
RESULTS
Post-transplant outcomes
At a median follow up of 3.5 years, 35 out of 85 patients had relapsed with a 10-year cumulative relapse incidence of 44% and a median time to relapse of 226 days (range, 33 to 1774) after transplant (Figure 1A). Overall survival was significantly poorer in the relapsed patients compared to non-relapsed patients (P<0.001) and most of the relapsed patients (92%) died from relapse or its complications. Post-relapse survival was significantly inferior among subjects relapsing before 180 days post allo-SCT (median post-relapse survival 126 days vs. 329 days for patients relapsing after 180 days; P=0.004, Figure 1B). There was no difference of the relapse incidences between three clinical protocols (P=0.94). Other transplant parameters were similar between relapsed and non-relapsed subjects, including recipient age, donor age, donor-recipient gender mismatch, diagnosis, disease risk, cytomegalovirus (CMV) reactivation, acute or chronic GVHD (Supplementary Table 3).
Figure 1.
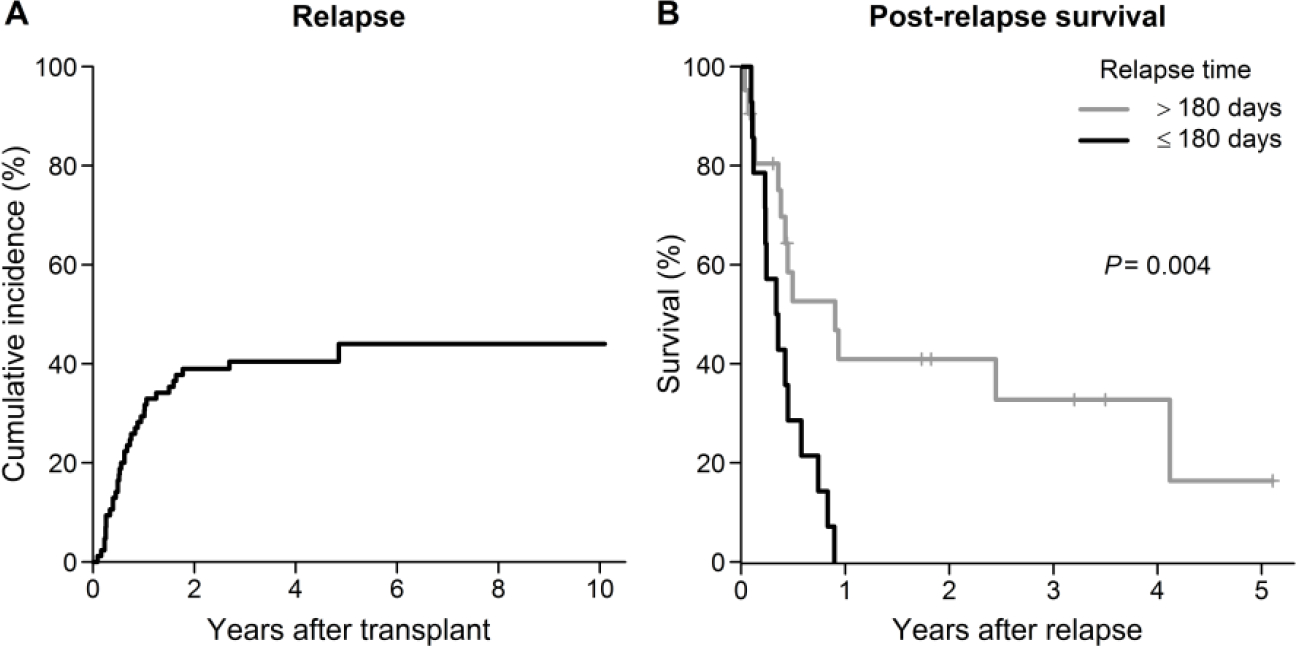
(A) Cumulative incidence of relapse. (B) Kaplan-Meier estimate of post-relapse survival in subjects with the time to relapse >180 vs. ≤ 180 days.
Early T-cell Reconstitution and Relapse
To investigate whether T cell reconstitution in the early post-transplant phase affected the relapse incidence and outcome, we analyzed T cell memory subset, regulatory T cells (Tregs), and PD-1 expression in both CD4 and CD8 T cells in the donor and at day 30, day 60, and day 100 following allo-SCT.
Post-transplant PD-1 expression in CD4 and CD8 T-cells was significantly and comparably elevated in both relapsed and non-relapsed cohorts when compared to donors (Figure 2A and 2B). No association was observed between relapse incidence and pattern of PD-1 expression. In contrast, %Helios+Tregs was significantly higher in the relapsed cohort at day 30 (P=0.01, Figure 2C).
Figure 2.
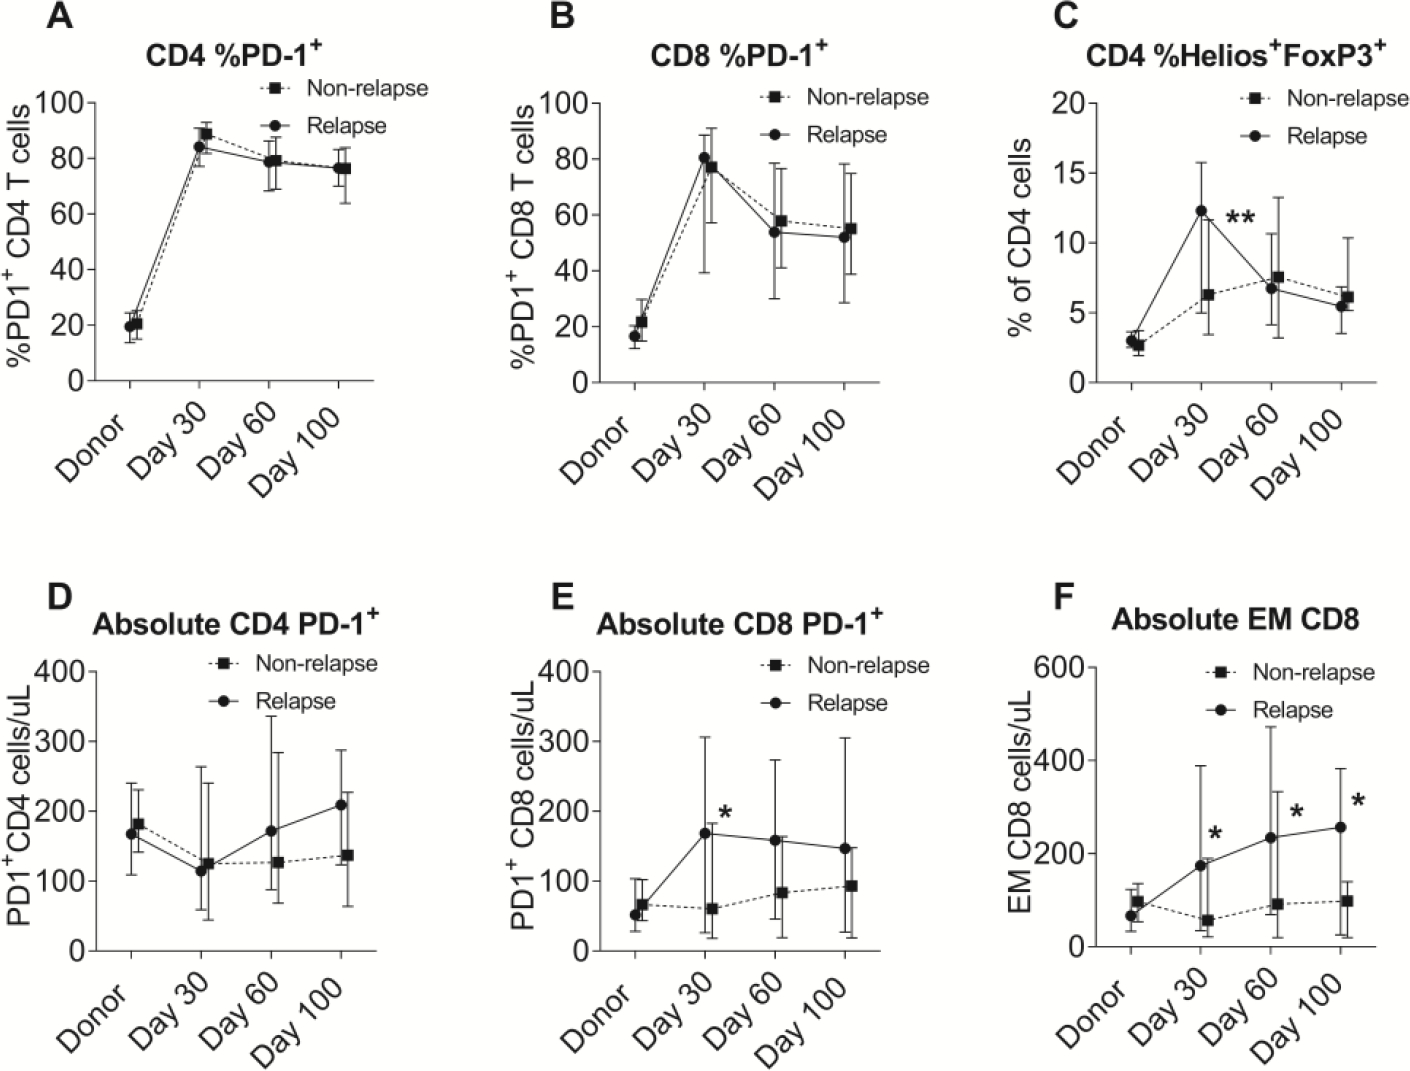
Comparison of cellular immune subsets between the relapsed and non-relapsed cohorts. (A) Percentages of PD-1+ in CD4 cells. (B) Percentages of PD-1+ in CD8 cells. (C) Percentages of Helios+FoxP3+ in CD4 cells. (D) Absolute numbers of PD-1+CD4 cells. (E) Absolute numbers of PD-1+CD8 cells. (F) Absolute numbers of effector memory CD8 cells.
Absolute numbers of each subpopulation of T cells were also analyzed. Although absolute number of PD-1+ CD4 cells was similar between the cohorts (Figure 2D), absolute PD-1+ CD8 cells were significantly higher at day 30 (P=0.03) in the relapsed cohort (Figure 2E). However, absolute PD-1+ CD8 number was significantly correlated to absolute number of effector memory (EM) CD8 cells which was significantly higher in the relapsed cohort at all time points in early post-transplant period (P<0.05; Figure 2F).
Predictive Biomarkers of T-cell Reconstitution for Relapse
In multivariate analysis using either continuous or dichotomized variables, %Helios+ Tregs CD4 cell and absolute number of CD8 effector memory cells at day 30 were identified as independent biomarkers predicting relapse (Supplementary Table 4). %Helios+Tregs CD4 cells greater than 10% of CD4 cells and absolute number of CD8 effector memory cells greater than 150/uL at day 30 were significantly associated with a higher risk and earlier incidence of relapse (P=0.003 and P=0.008, respectively; Figure 3A, 3B, and Supplementary Figure 2). PD-1 expression did not predict the incidence of relapse in this cohort. In the Cox regression analysis with GVHD as a time-dependent covariate, we found neither incidence or severity of acute or chronic GVHD was significantly associated with relapse (P>0.1, Supplementary Table 3). Furthermore, %Helios+Tregs or the effector memory CD8 T cells were not significantly associated with acute or chronic GVHD (P>0.1).
Figure 3.
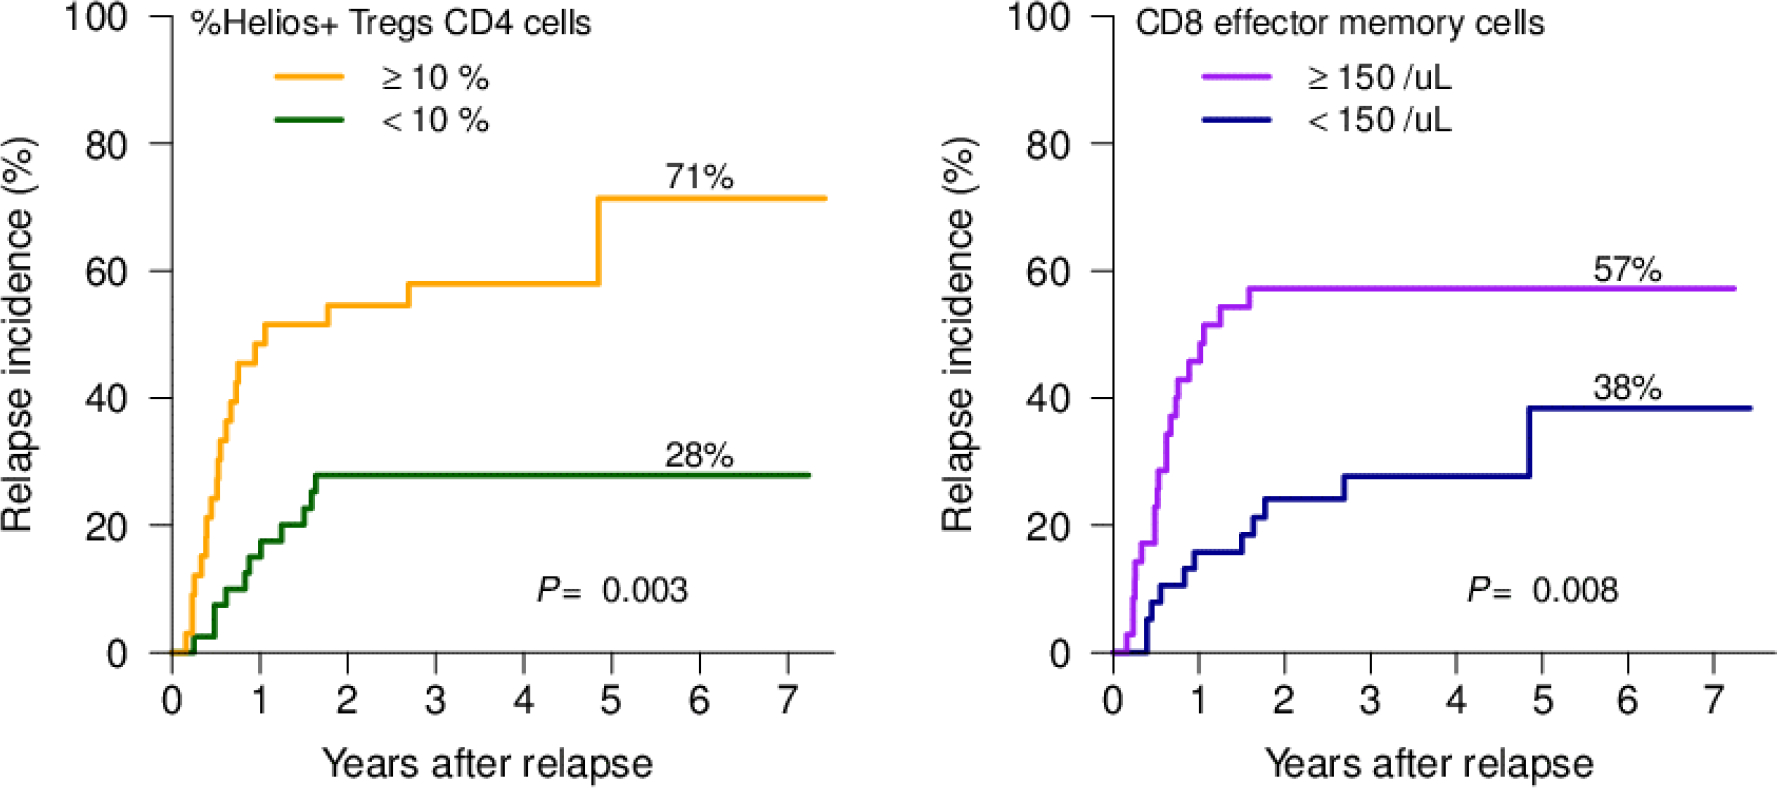
Cumulative incidence of relapse in (A) subjects with %Helios+Tregs CD4 cells at day 30 <10% vs. ≥ 10%. (B) subjects with absolute number of CD8 effector memory cells at day 30 <150 /uL vs. ≥150 /uL.
PD-1 and Other T-cell Exhaustion Markers at Relapse
In 24 out of 35 relapsed subjects where blood samples were saved at the time of relapse, we analyzed PD-1, LAG3, TIM-3, PDL-1 expressions in both CD4 and CD8 T cells, compared to the corresponding pre-transplant donor samples. The median time from the transplant to relapse was 183 days in these 24 individuals. Compared with donors, the proportion of PD-1 expressing cells were significantly higher in both CD4 and CD8 T cells in relapsed patients (mean %PD-1+ CD4 cells, 17.7±7.2 in donor vs. 65.8±18.5 in relapsed patients, P<0.0001; mean %PD-1+ CD8 cells, 16.4±9.5 in donors vs. 41.3±25.5 in relapsed patients, P<0.0001). The increased expressions of PD-1 were observed in all compartments of CD4 and CD8 T cell memory subsets including naïve and stem cell memory subset (Figure 4A and 4E). In contrast, differential expressions of LAG3, TIM3, and PDL-1 expressions were limited to certain memory subsets (Figure 4B–D, 4F–H). This observation suggests that high PD-1 expressions in T cells persisted at the time of post-transplant relapse and was present even in the early stages of T cell maturation. Other T-cell exhaustion markers (LAG3, TIM3, and PDL-1) appeared to have a more distinct phenotype at leukemia relapse.
Figure 4.
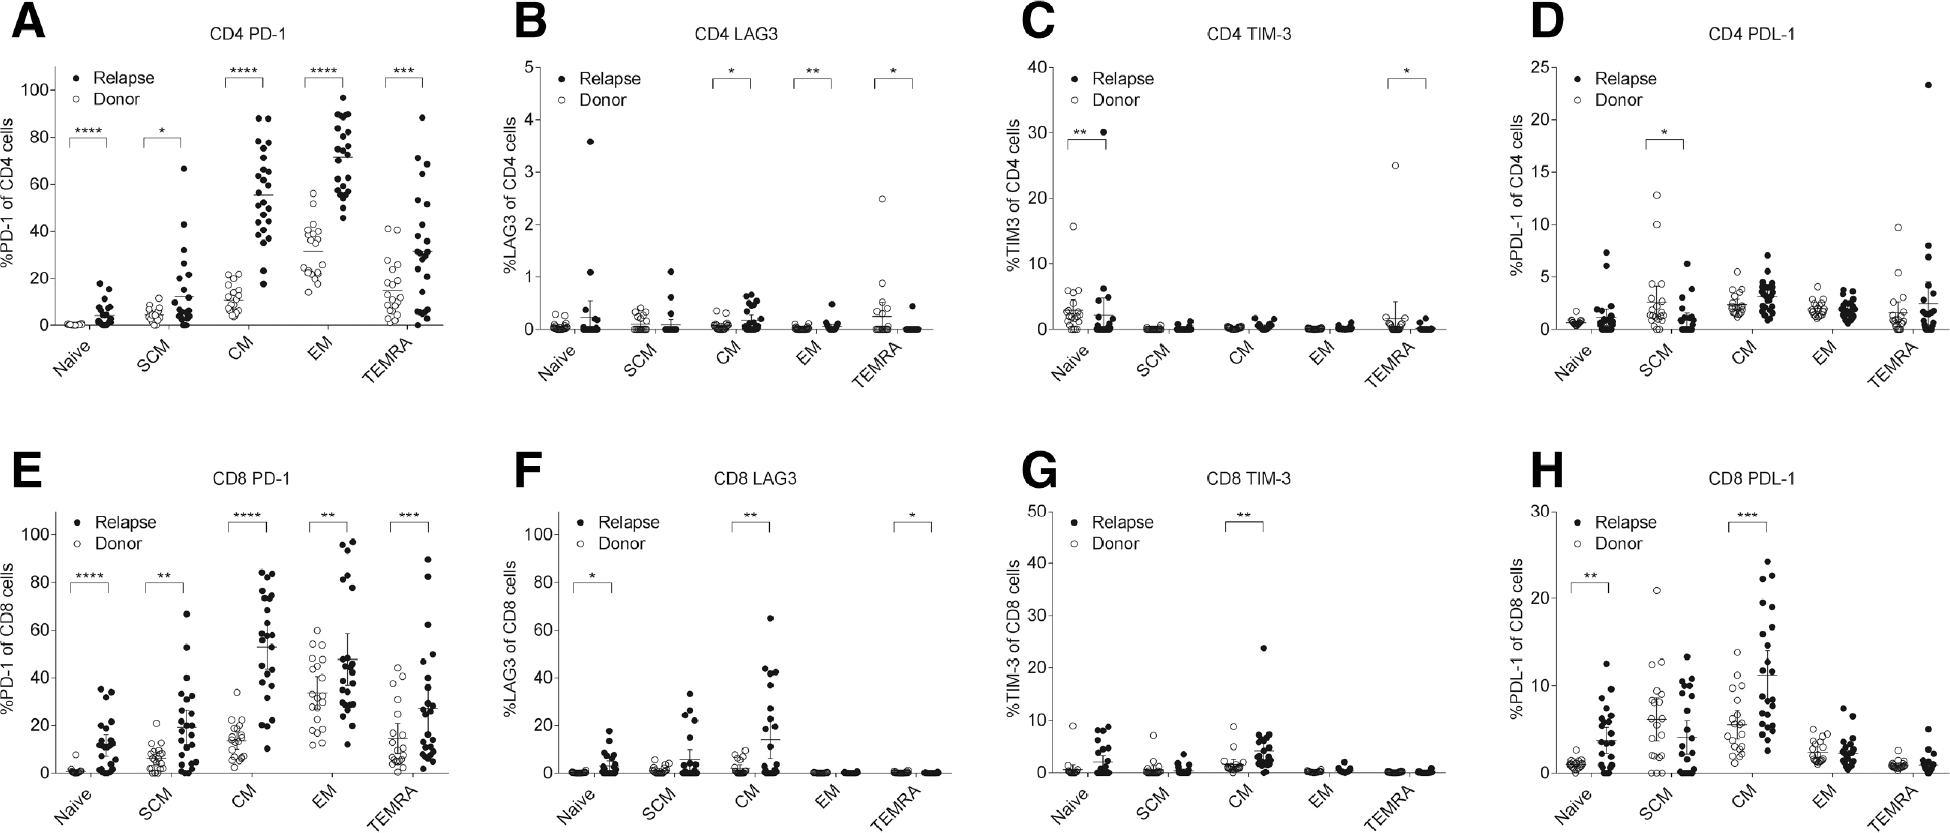
Comparison of exhaustion marker expressions in T cell memory subsets between the relapsed cohort and paired donor cohorts. (A) Percentages of PD-1+ in CD4 cells. (B) Percentages of LAG3+ in CD4 cells. (C) Percentages of TIM-3+ in CD4 cells. (D) Percentages of PDL-1+ in CD4 cells. (E) Percentages of PD-1+ in CD8 cells. (F) Percentages of LAG3+ in CD8 cells. (G) Percentages of TIM-3+ in CD8 cells. (H) Percentages of PDL-11+ in CD8 cells. Abbreviations: CM, central memory; EM, effector memory; SCM, stem cell memory; TEMRA, effector memory RA.
Leukemia Associated Antigen Specific T-cells
To explore the role of PD-1 expressions in GVL effects, we further analyzed six relapsed subjects (5 AML, 1 ALL) for blast cell expression of 5 LAA (AURAK, NY-ESO1, MAGEA3, PRAME, WT1) and corresponding T cells specific to these LAA. PBMCs from relapsed patients expressed at least one and up to four LAA by RT-PCR before and after relapse in all patients. LAA specific T-cells were observed in four subjects by Elispot, however all relapsed samples eventually expressed new LAA different from those targeted by their own LAA specific T-cells, suggesting immunological escape of leukemic blasts (Figure 5A). In UPN1 and UPN3, PRAME-specific T cells were also measurable by flow cytometry at the time of relapse. While CMV-specific T cells were enriched in PD-1 positive fractions, PRAME-specific T cells were disproportionately detected in the PD-1 negative fractions (Figure 5B). This implies that the PD-1 overexpression at relapse was more likely to be derived from T cells specific for viruses or other chronically exposed antigen and was unlikely from leukemia-specific T cells.
Figure 5.
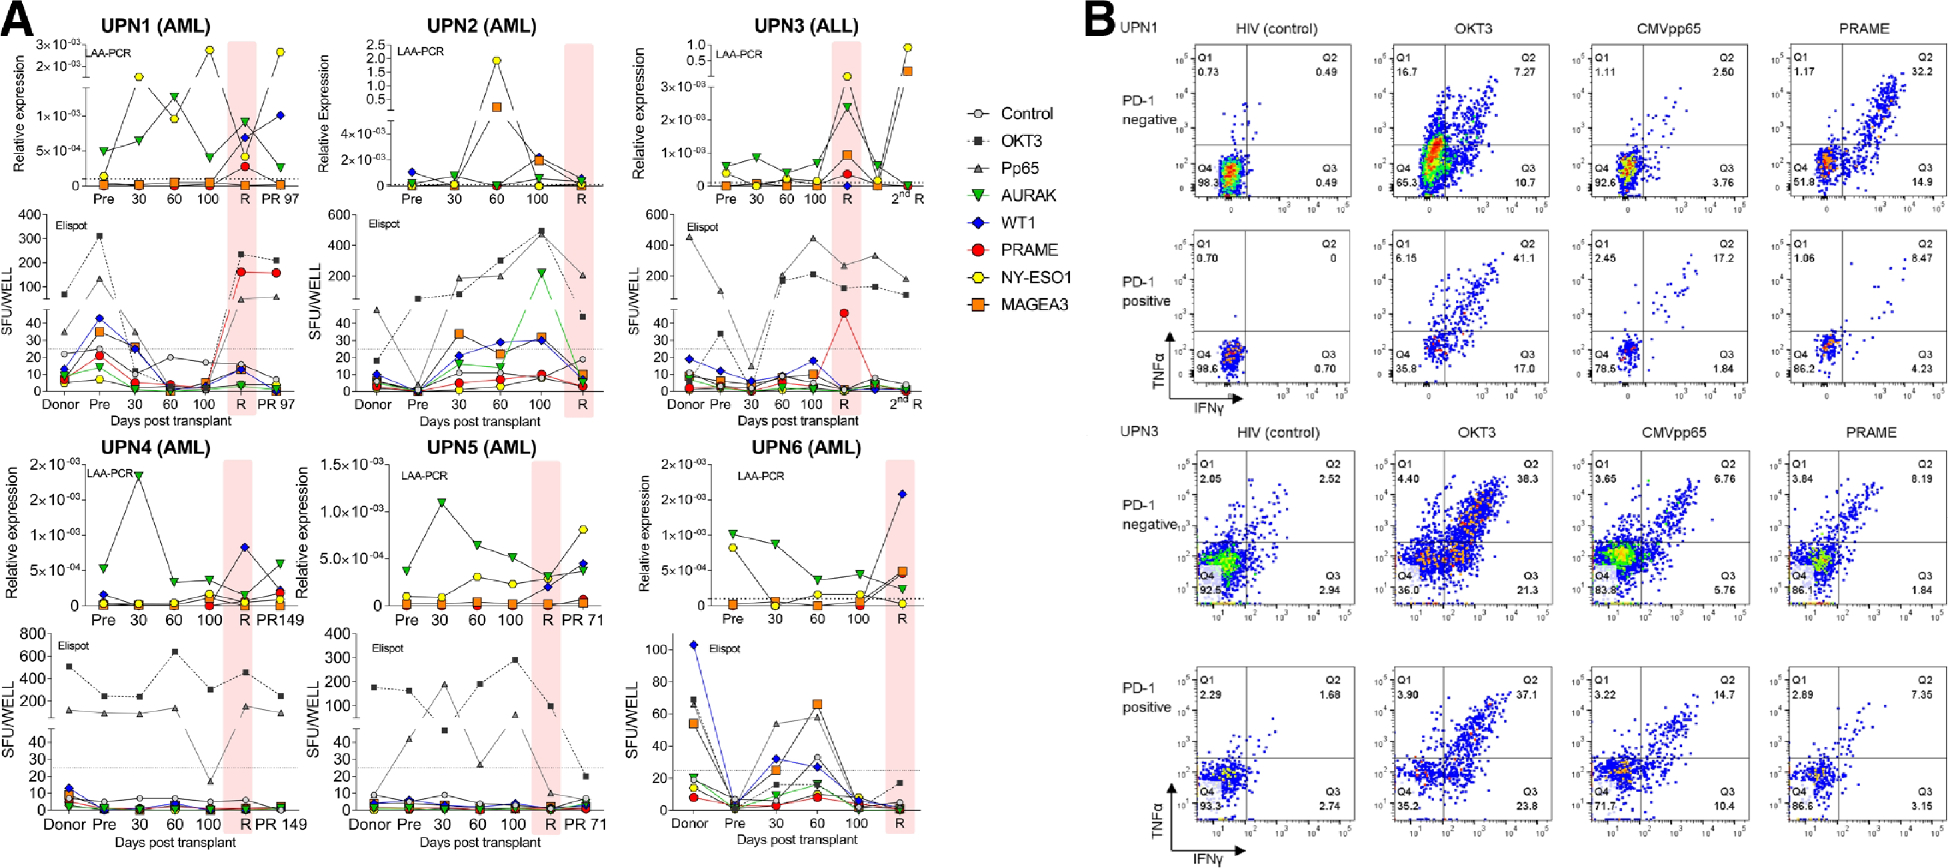
(A) Correlation between leukemia associated antigen (LAA) and antigen specific T cells in six subjects. Five LAAs (AURAK, NY-ESO,1, MAGEA3, PRAME, WT1) were quantified in peripheral blood by reverse transcription polymerase chain reaction (RT-PCR) and leukemia specific T cells were simultaneously measured by enzyme-linked immunosorbent spot-forming cell assay (Elispot). (B) Representative flow data of antigen specific T cells in PD-1 negative or positive fractions (UPN1 and UPN3). HIV was used as negative control and OKT3 as positive control. Abbreviation: 2nd R, second relapse; PR, post-relapse; R, relapse; SFU; spot forming units; R, relapse.
Single Cell RNA-seq Analysis of PRAME and CMV-specific T cells at Relapse
Next, we performed single cell RNA-seq analysis of T cells specific to virus or leukemia from UPN1 sample at relapse. Briefly, PBMC were stimulated with peptide pools of either CMVpp65 or PRAME, then both TNFα positive and negative fractions of T cells were sorted by flow cytometry for single cell transcriptome analysis. An average of 1436 cells per condition were analyzed with mean reads number of 381,079 per cell and median gene number of 1091 per cell. Cluster analysis of the four pooled samples (CMVpp65 positive or negative and PRAME positive or negative) revealed heterogenous population of 13 clusters (Figure 6A). Clusters were roughly classified into three categories which predominantly consisted of 1) CMVpp65 and PRAME positive T cells (clusters 2, 6, 9, 10, 11 shown in red box), 2) CMVpp65 and PRAME negative T cells (clusters 1, 3, 7, 8, 13 shown in blue box), and 3) non-specific T cells (cluster 4, 5, 12 shown in orange box) (Figure 6B). Among the clusters of antigen-reactive T cells, Gene Ontology analyses confirmed cluster 2 was enriched for the genes involved tumor necrosis factor receptor mediated signaling pathway. Cluster 9 and 11 have distinct gene signatures related to cell division, DNA replication, mitotic nuclear division, and sister chromatid cohesion suggesting actively proliferating T cell population (Supplementary Table 5). Individual gene analysis at single cell level revealed PDCD1 (PD-1) was barely expressed in PRAME reactive T-cells. In contrast, LAG3 and HAVCR2 (TIM3) were highly expressed in the activated T cell portion of PRAME reactive T cells but not in CMV reactive T cells (Figure 6C). The observation was consistent with flow cytometry analysis that PRAME reactive T-cells were predominantly enriched in the PD-1 negative fraction in this subject.
Figure 6.
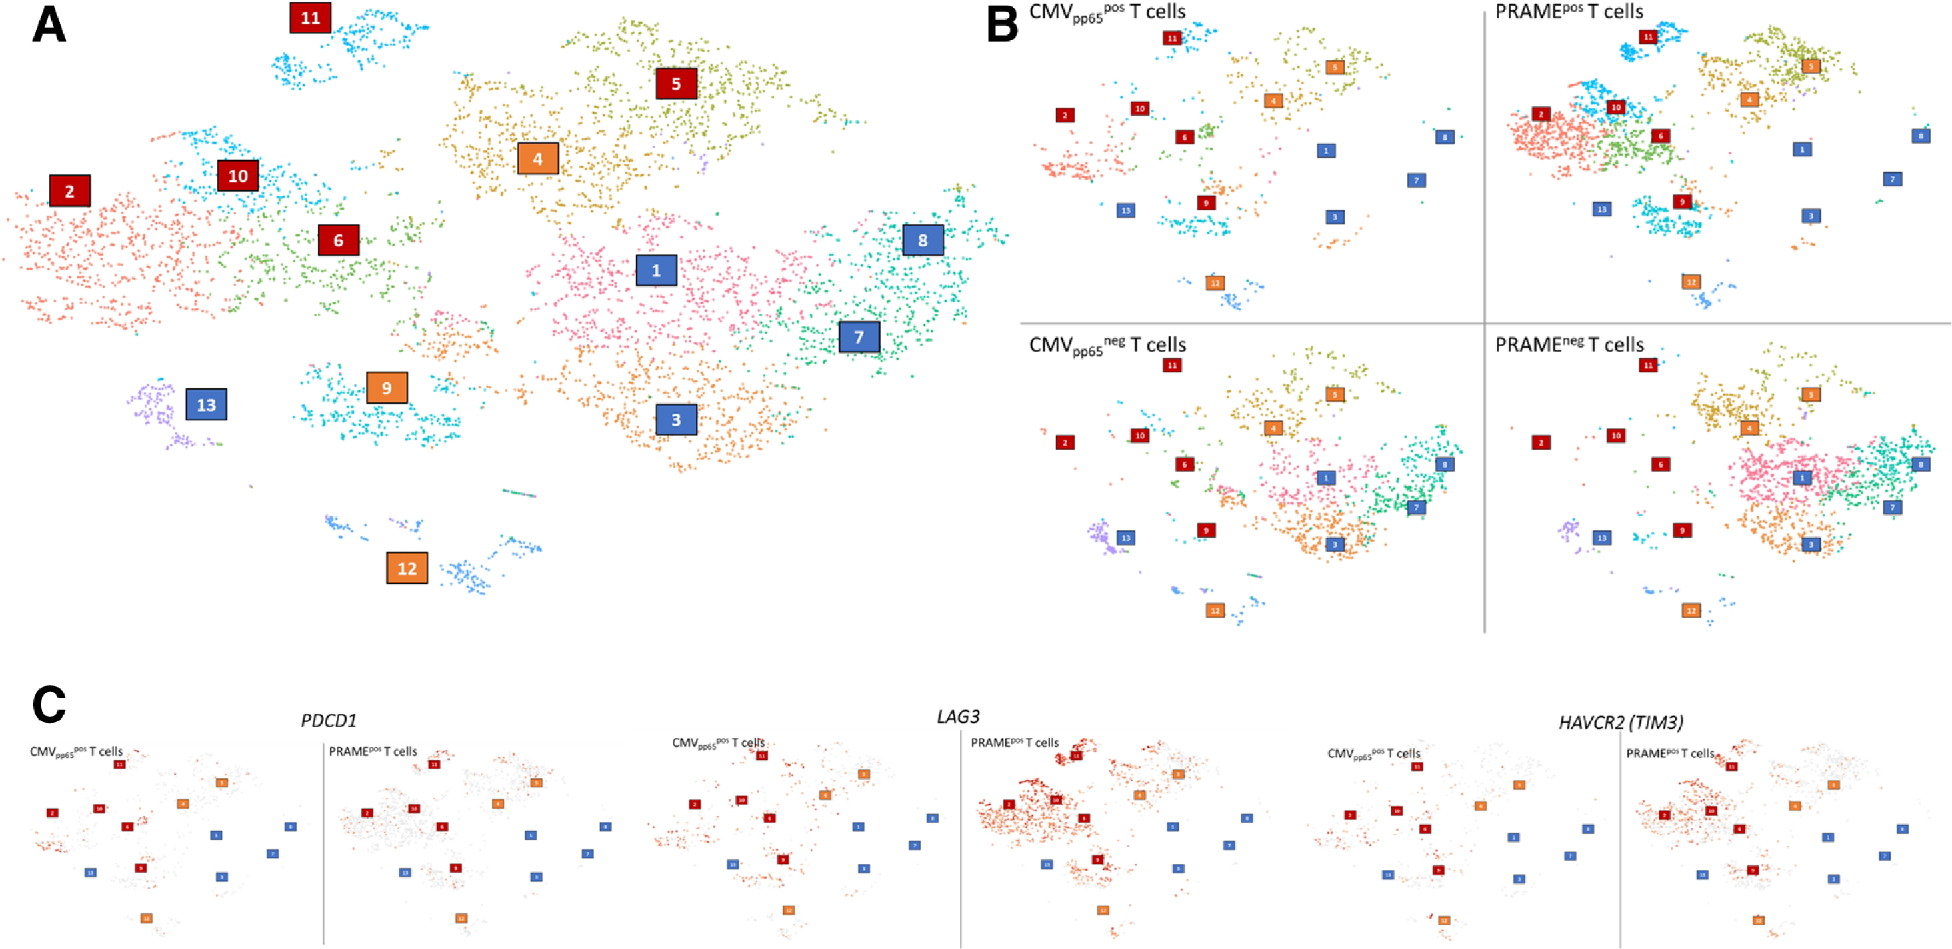
Single cell RNA-seq analysis of PRAME and CMVpp65 specific T cells at relapse in UPN1. (A) Cluster analysis of the four pooled samples. Clusters were roughly classified into three categories: CMVpp65 and PRAME positive T cells, clusters 2, 6, 9, 10, 11 shown in red boxes; CMVpp65 and PRAME negative T cells, clusters 1, 3, 7, 8, 13 shown in blue boxes; and non-specific T cells, cluster 4, 5, 12 shown in orange boxes. (B) Cluster analysis of each four samples: CMVpp65 positive or negative cells and PRAME positive or negative cells. (C) Comparison of expression profiles of exhaustion markers in CMVpp65 and PRAME positive T cells at single cell level. PDCD1 (PD-1) in left, LAG3 in middle, and HAVCR2 (TIM-3) in right.
DISCUSSION
Post-transplant relapse remains the major cause of transplant failure occurring in 20–40% of standard risk and in 40–80% of high risk patients and accounting for more than half of deaths after allo-SCT.1,12 Outcomes of post-transplant relapse are extremely poor with 1 year and 3 year-overall survival of 22% and <10% respectively.2,13 There is an urgent need to prevent and treat post-transplant relapse through new strategies to enhance GVL effects without inducing severe GVHD. To optimize immunological approaches to prevent and treat relapse, we studied the kinetics of suppressive markers of cellular immunity after allo-SCT and its relationship to the incidences of subsequent relapse.
In this study, we found that PD-1 was ubiquitously overexpressed in T-cells during the early post-transplant period and PD-1 expression patterns did not selectively identify patients destined to relapse. We further showed that PD-1 was not overexpressed in the leukemia antigen specific T-cells, rather PD-1 positive fractions were enriched with CMV specific T cells. This observation is consistent with the previous report of Gallez-Hawkins et al. demonstrating enhanced PD-1 expression during CMV reactivation and severe GVHD after allo-SCT.14 In another report, high PD-1 expression in CD4 cells was associated with non-survivors in allo-SCT of various stem cell sources.15 Therefore PD-1 blockade after allo-SCT may be a double-edged sword promoting anti-virus immunity but inducing severe GVHD without increasing GVL effects. Finally, single cell analysis revealed LAG3 and TIM3 overexpression in PD-1 negative PRAME specific T cells. This preliminary result implies possible roles for other exhaustion markers in the mechanisms of post-transplant relapse. Alternatively, lack of PD-1 expression indicates PRAME specific T cells may not have been fully functional in this subject since PD-1 is also recognized as a marker of T cell activation.
In contrast to the indiscriminate expression of PD-1 in all post-transplant patients irrespective of relapse status, two independent biomarkers at day 30 post-transplant, Helios+ Tregs CD4 cells and absolute number of CD8 effector memory cells strongly associated with higher incidence of relapse. Helios is a key transcription factor in Tregs which stabilizes the functions of Tregs through STAT5 activation16 and epigenetically silencing IL-2 expression17. Nakagawa et al. recently reported that selective deletion of Helios in CD4 Tregs enhanced anti-tumor immunity in a mouse model18 suggesting Helios+ Tregs CD4 cells favor a permissive microenvironment for solid tumor growth. In allo-SCT, however, the roles of Helios+ Tregs in pathogenesis of GVHD and GVL remain undefined 19,20 and further studies are needed to validate Helios as a biomarker of post-transplant relapse and as a potential therapeutic target.
There are several limitations in this study. First, our observation was limited to ex-vivo T cell depleted matched related donor allo-SCT after a TBI-based myeloablative conditioning regimen. The kinetics of post-transplant PD-1 expressions may differ according to the donor type, graft source, conditioning regimen, GVHD prophylaxis, and post-transplant therapy. Further study is needed to validate our findings in a larger cohort. Second, we only evaluated LAG3, TIM3, and PDL-1 at relapse and not in early post-transplant samples. Smaller cohort study showed the higher expressions of PD-1 and TIM-3 in relapsed subjects (n=5) in comparison to non-relapsed subjects (n=6) at various timepoint after allo-SCT.21 However, we cannot assume that other exhaustion markers reliably predict post-transplant relapse. Third, antigen specific T cells were analyzed only for commonly shared leukemia associated antigens (AURAK, NY-ESO1, MAGEA3, PRAME, WT1). In HLA matched allo-SCT, hematopoietic lineage specific minor histocompatibility antigens (MiHA) are known to induce allo-immunity responsible for a GVL effect. Norde et al. previously reported impaired function of MiHA specific T cells through PD-1/PDL-1 axis at post-transplant relapse.22 In our cohort, we did not have information about the disparity at the level of single nucleotide polymorphism (SNP) in MiHA genes (HA-1, HA-2, LRH-1, HB-1, ACC-1/ACC-2, UTA2–1, HEATR-1, AAC-6) between donor and recipient. We therefore could not analyze T cell populations specific to MiHA.23 In solid tumors, neoantigen specific T cells were reported to be enriched in PD-1 positive fractions in either tumor infiltrating lymphocytes or peripheral blood.24 25 However, the somatic mutation burdens of acute leukemia are generally low, so the potency of neoantigen specific T cells in GVL remains undetermined. Lastly, single cell RNAseq analysis was conducted in only one representative sample. Despite LAG3 and TIM3 seemed overexpressed in PRAME-specific T cells, single cell RNAseq data could not distinguish whether these molecules expressed on the cell surface or intracellular compartment. Murine model suggested that LAG3 molecules were mainly stored intracellularly and rapidly translocated to the cell surface when T cells were activated.26 Functional significance of both surface and intracellular expressions of LAG3 and TIM3 remain undetermined in leukemia-specific T cells. While these findings cannot be generalized to all post-transplant relapses, the case validated the lack of RNA expressions of PD-1 in PRAME-specific T cells, highlighting the heterogeneity of antigen specific T cell populations at a single cell level. Further study is needed to define the diversity and heterogeneity of the T cell repertoire in post-transplant relapse.
In conclusion, our findings do not support PD-1 being the predominate marker for leukemia specific T cell exhaustion in relapsing patients post-transplant but instead identify other exhaustion markers and suppressor cells as indicators of relapse. Our study also illustrated the unmet need of understanding the GVL effects in human samples to develop rationale combination therapies of check point inhibitors and other immunotherapies in hematologic malignancies following allo-SCT.
Supplementary Material
HIGHLIGHTS.
PD-1 was overexpressed in T-cells after allo-SCT irrespective to subsequent relapse
Helios+Tregs cells and CD8 EM cells emerged as independent predictors of relapse
Single cell analysis revealed overexpression of other exhaustion markers at relapse
ACKNOWLEDGEMENTS:
We thank Tameem Ansari, Jodi Hanson, and Jaya Ghosh (Cellular Technology Limited, Shaker Heights, OH, USA) for their technical support. We also thank all patients who donated the samples to this study. This research was supported by the Intramural Research Program of the National Heart, Lung, and Blood Institute at the National Institutes of Health.
Footnotes
CONFLICT OF INTEREST:
All authors declare no conflict of interest.
Publisher's Disclaimer: This is a PDF file of an unedited manuscript that has been accepted for publication. As a service to our customers we are providing this early version of the manuscript. The manuscript will undergo copyediting, typesetting, and review of the resulting proof before it is published in its final citable form. Please note that during the production process errors may be discovered which could affect the content, and all legal disclaimers that apply to the journal pertain.
REFERENCES:
- 1.Barrett AJ, Battiwalla M. Relapse after allogeneic stem cell transplantation. Expert Rev Hematol. 2010;3(4):429–441. [DOI] [PMC free article] [PubMed] [Google Scholar]
- 2.Frangoul H, Jagasia M. Relapse post hematopoietic SCT remains the Achilles heel for the field. Bone Marrow Transplant. 2014;49(8):997–998. [DOI] [PubMed] [Google Scholar]
- 3.Kekre N, Koreth J. Novel strategies to prevent relapse after allogeneic haematopoietic stem cell transplantation for acute myeloid leukaemia and myelodysplastic syndromes. Curr Opin Hematol. 2015;22(2):116–122. [DOI] [PubMed] [Google Scholar]
- 4.Miller JS, Warren EH, van den Brink MR, et al. NCI First International Workshop on The Biology, Prevention, and Treatment of Relapse After Allogeneic Hematopoietic Stem Cell Transplantation: Report from the Committee on the Biology Underlying Recurrence of Malignant Disease following Allogeneic HSCT: Graft-versus-Tumor/Leukemia Reaction. Biol Blood Marrow Transplant. 2010;16(5):565–586. [DOI] [PMC free article] [PubMed] [Google Scholar]
- 5.Cairo MS, Jordan CT, Maley CC, et al. NCI first International Workshop on the biology, prevention, and treatment of relapse after allogeneic hematopoietic stem cell transplantation: report from the committee on the biological considerations of hematological relapse following allogeneic stem cell transplantation unrelated to graft-versus-tumor effects: state of the science. Biol Blood Marrow Transplant. 2010;16(6):709–728. [DOI] [PMC free article] [PubMed] [Google Scholar]
- 6.Barrett AJ. Understanding and harnessing the graft-versus-leukaemia effect. Br J Haematol. 2008;142(6):877–888. [DOI] [PubMed] [Google Scholar]
- 7.Xu-Monette ZY, Zhou J, Young KH. PD-1 expression and clinical PD-1 blockade in B-cell lymphomas. Blood. 2018;131(1):68–83. [DOI] [PMC free article] [PubMed] [Google Scholar]
- 8.Davids MS, Kim HT, Bachireddy P, et al. Ipilimumab for Patients with Relapse after Allogeneic Transplantation. N Engl J Med. 2016;375(2):143–153. [DOI] [PMC free article] [PubMed] [Google Scholar]
- 9.Haverkos BM, Abbott D, Hamadani M, et al. PD-1 blockade for relapsed lymphoma post-allogeneic hematopoietic cell transplant: high response rate but frequent GVHD. Blood. 2017;130(2):221–228. [DOI] [PMC free article] [PubMed] [Google Scholar]
- 10.Gray RJ. A class of K-sample tests for comparing the cumulative incidence of a competive risk. The Annals of Statistics. 1988;16(3):1141–1154. [Google Scholar]
- 11.Huang da W, Sherman BT, Lempicki RA. Systematic and integrative analysis of large gene lists using DAVID bioinformatics resources. Nat Protoc. 2009;4(1):44–57. [DOI] [PubMed] [Google Scholar]
- 12.Pavletic SZ, Kumar S, Mohty M, et al. NCI First International Workshop on the Biology, Prevention, and Treatment of Relapse after Allogeneic Hematopoietic Stem Cell Transplantation: report from the Committee on the Epidemiology and Natural History of Relapse following Allogeneic Cell Transplantation. Biol Blood Marrow Transplant. 2010;16(7):871–890. [DOI] [PMC free article] [PubMed] [Google Scholar]
- 13.Bejanyan N, Oran B, Shanley R, et al. Clinical outcomes of AML patients relapsing after matched-related donor and umbilical cord blood transplantation. Bone Marrow Transplant. 2014;49(8):1029–1035. [DOI] [PMC free article] [PubMed] [Google Scholar]
- 14.Gallez-Hawkins GM, Thao L, Palmer J, et al. Increased programmed death-1 molecule expression in cytomegalovirus disease and acute graft-versus-host disease after allogeneic hematopoietic cell transplantation. Biol Blood Marrow Transplant. 2009;15(7):872–880. [DOI] [PMC free article] [PubMed] [Google Scholar]
- 15.Schade H, Sen S, Neff CP, et al. Programmed Death 1 Expression on CD4(+) T Cells Predicts Mortality after Allogeneic Stem Cell Transplantation. Biol Blood Marrow Transplant. 2016;22(12):2172–2179. [DOI] [PubMed] [Google Scholar]
- 16.Kim HJ, Barnitz RA, Kreslavsky T, et al. Stable inhibitory activity of regulatory T cells requires the transcription factor Helios. Science. 2015;350(6258):334–339. [DOI] [PMC free article] [PubMed] [Google Scholar]
- 17.Baine I, Basu S, Ames R, Sellers RS, Macian F. Helios induces epigenetic silencing of IL2 gene expression in regulatory T cells. J Immunol. 2013;190(3):1008–1016. [DOI] [PMC free article] [PubMed] [Google Scholar]
- 18.Nakagawa H, Sido JM, Reyes EE, Kiers V, Cantor H, Kim HJ. Instability of Helios-deficient Tregs is associated with conversion to a T-effector phenotype and enhanced antitumor immunity. Proc Natl Acad Sci U S A. 2016;113(22):6248–6253. [DOI] [PMC free article] [PubMed] [Google Scholar]
- 19.Hirakawa M, Matos TR, Liu H, et al. Low-dose IL-2 selectively activates subsets of CD4(+) Tregs and NK cells. JCI Insight. 2016;1(18):e89278. [DOI] [PMC free article] [PubMed] [Google Scholar]
- 20.Cantilena CR, Ito S, Tian X, et al. Distinct Biomarker Profiles in Ex Vivo T Cell Depletion Graft Manipulation Strategies: CD34(+) Selection versus CD3(+)/19(+) Depletion in Matched Sibling Allogeneic Peripheral Blood Stem Cell Transplantation. Biol Blood Marrow Transplant. 2018;24(3):460–466. [DOI] [PMC free article] [PubMed] [Google Scholar]
- 21.Kong Y, Zhang J, Claxton DF, et al. PD-1(hi)TIM-3(+) T cells associate with and predict leukemia relapse in AML patients post allogeneic stem cell transplantation. Blood Cancer J. 2015;5:e330. [DOI] [PMC free article] [PubMed] [Google Scholar]
- 22.Norde WJ, Maas F, Hobo W, et al. PD-1/PD-L1 interactions contribute to functional T-cell impairment in patients who relapse with cancer after allogeneic stem cell transplantation. Cancer Res. 2011;71(15):5111–5122. [DOI] [PubMed] [Google Scholar]
- 23.Oostvogels R, Lokhorst HM, Mutis T. Minor histocompatibility Ags: identification strategies, clinical results and translational perspectives. Bone Marrow Transplant. 2016;51(2):163–171. [DOI] [PubMed] [Google Scholar]
- 24.Gros A, Parkhurst MR, Tran E, et al. Prospective identification of neoantigen-specific lymphocytes in the peripheral blood of melanoma patients. Nat Med. 2016;22(4):433–438. [DOI] [PMC free article] [PubMed] [Google Scholar]
- 25.Tran E, Robbins PF, Rosenberg SA. ‘Final common pathway’ of human cancer immunotherapy: targeting random somatic mutations. Nat Immunol. 2017;18(3):255–262. [DOI] [PMC free article] [PubMed] [Google Scholar]
- 26.Woo SR, Li N, Bruno TC, et al. Differential subcellular localization of the regulatory T-cell protein LAG-3 and the coreceptor CD4. Eur J Immunol. 2010;40(6):1768–1777. [DOI] [PMC free article] [PubMed] [Google Scholar]
Associated Data
This section collects any data citations, data availability statements, or supplementary materials included in this article.


