
Figure 5.
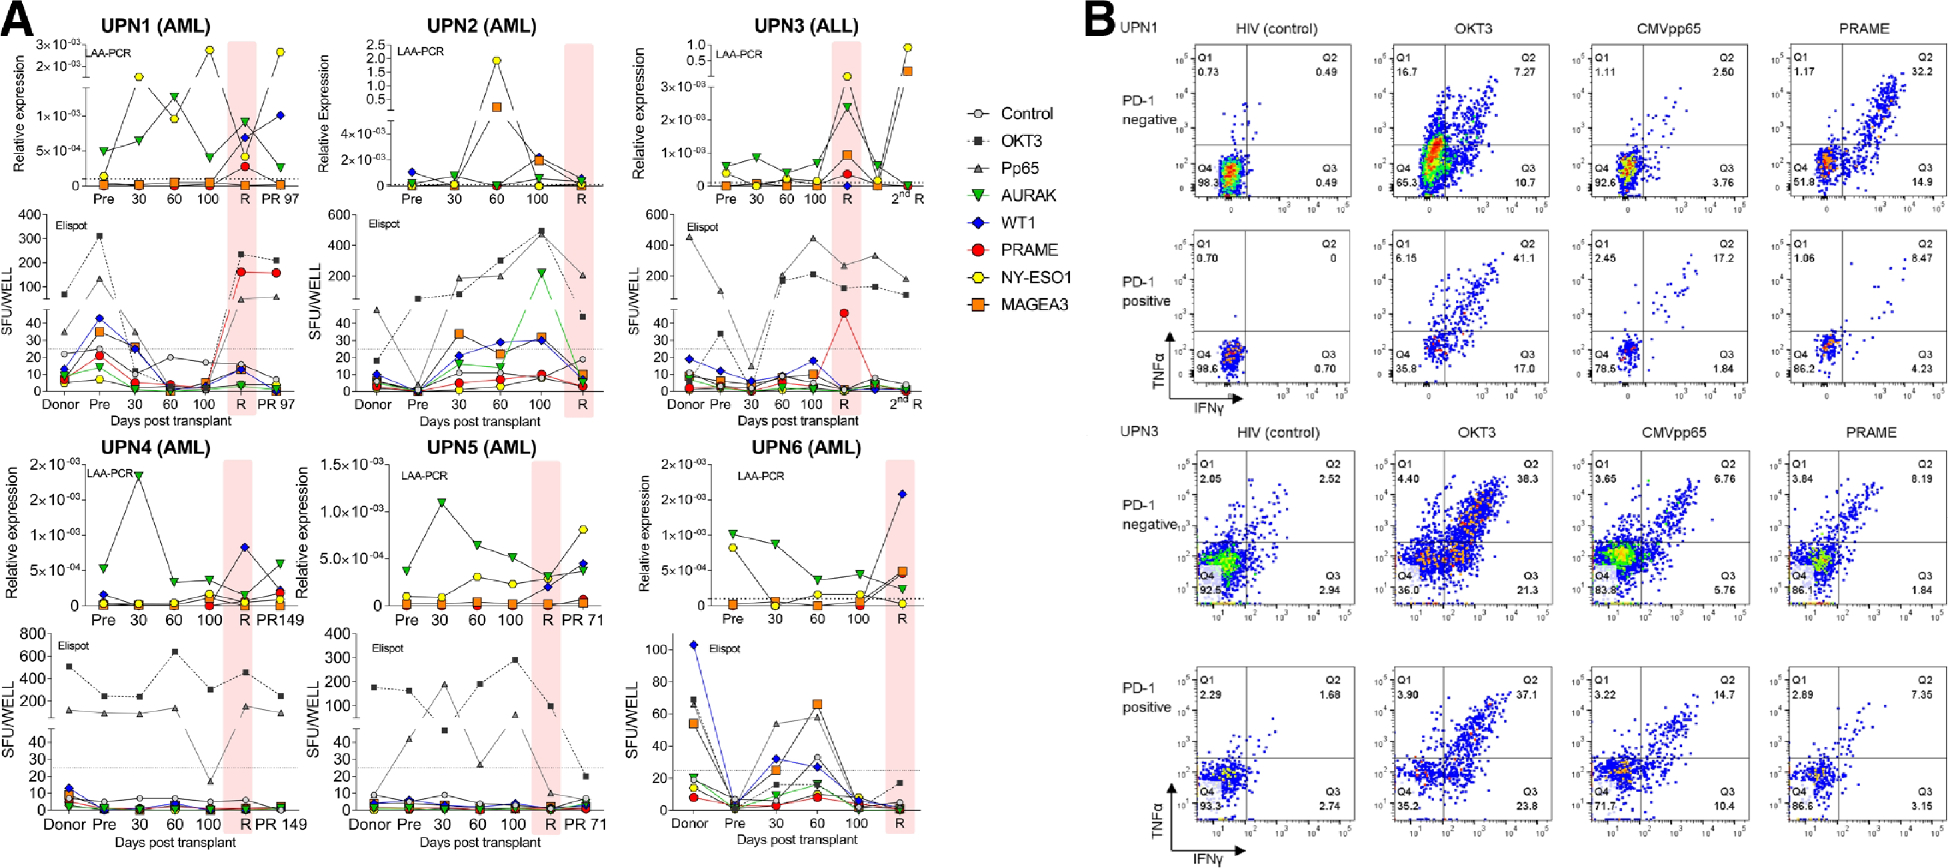
(A) Correlation between leukemia associated antigen (LAA) and antigen specific T cells in six subjects. Five LAAs (AURAK, NY-ESO,1, MAGEA3, PRAME, WT1) were quantified in peripheral blood by reverse transcription polymerase chain reaction (RT-PCR) and leukemia specific T cells were simultaneously measured by enzyme-linked immunosorbent spot-forming cell assay (Elispot). (B) Representative flow data of antigen specific T cells in PD-1 negative or positive fractions (UPN1 and UPN3). HIV was used as negative control and OKT3 as positive control. Abbreviation: 2nd R, second relapse; PR, post-relapse; R, relapse; SFU; spot forming units; R, relapse.