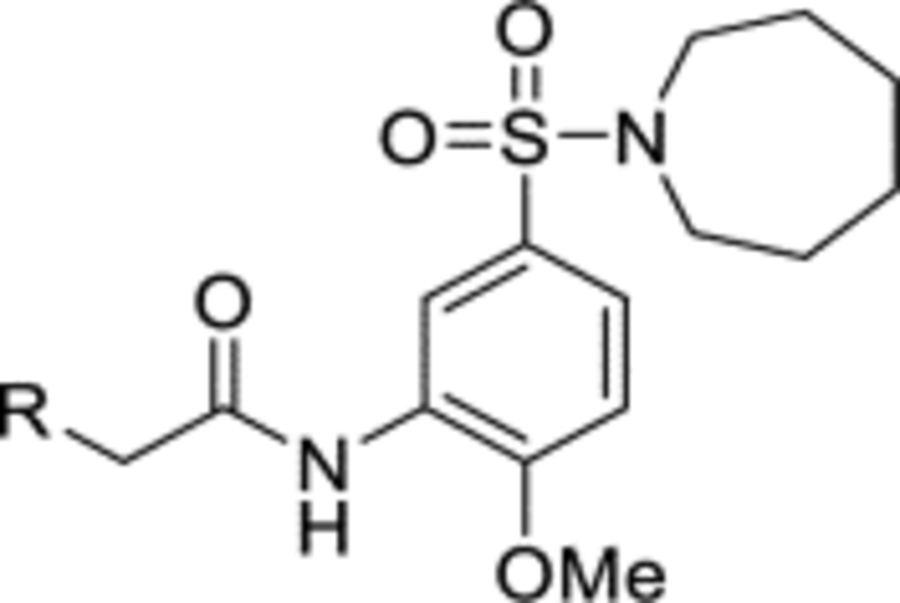
. Author manuscript; available in PMC: 2023 Sep 5.
Published in final edited form as: J Med Chem. 2019 Sep 27;62(23):10586–10604. doi: 10.1021/acs.jmedchem.9b01203

Table 3.

The inhibition at 50 μM ligand concentration or half-maximal inhibitory concentrations (IC50) afforded by compounds 1 and 15a-i.
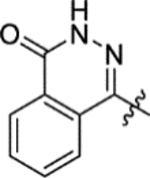
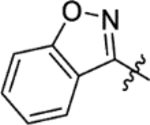
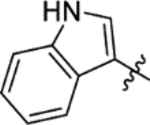
graphic file with name nihms-1928410-t0016.jpg
Compound R Inhibition (%) at 50 μM Compound R Inhibition (%) at 50 μM
1 graphic file with name nihms-1928410-t0017.jpg > 90a 15e graphic file with name nihms-1928410-t0018.jpg < 10
15a graphic file with name nihms-1928410-t0019.jpg 27 ± 6 15f graphic file with name nihms-1928410-t0020.jpg < 10
15b graphic file with name nihms-1928410-t0021.jpg 38 ± 5 15g graphic file with name nihms-1928410-t0022.jpg 86 ± 2b
15c graphic file with name nihms-1928410-t0023.jpg 12 ± 9 15h graphic file with name nihms-1928410-t0024.jpg 21 ± 17
15d graphic file with name nihms-1928410-t0025.jpg < 10 15i graphic file with name nihms-1928410-t0026.jpg < 10
a

IC50 2.0 ± 0.1 μM, consistent with previously reported value.14

b

IC50 4.1 ± 0.3 μM.