
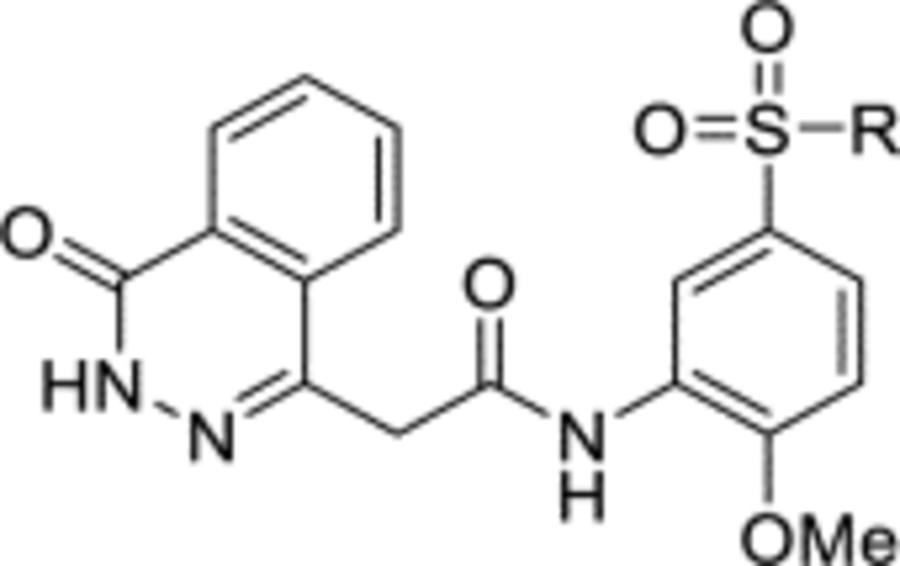
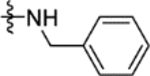
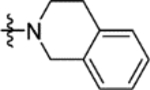
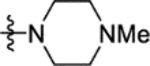
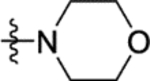
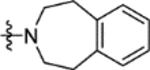
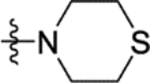
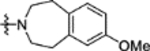
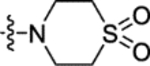
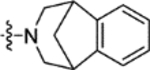
Table 4.
The inhibition at 50 μM ligand concentration or half-maximal inhibitory concentrations (IC50) afforded by compounds 16a-n
| |||||
|---|---|---|---|---|---|
| Compound | R | IC50 (μM) | Compound | R | IC50 (μM) |
| 16a |
|
57 ± 3 | 16h |
|
17 ± 3 |
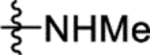
| 16b |
|
4.0 ± 0.1 | 16i |
|
NDa |
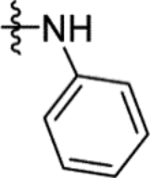
| 16c |

|
4.4 ± 0.1 | 16j |
|
2.2 ± 0.2 |
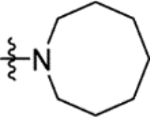
| 16d |
|
38 ± 2 | 16k |
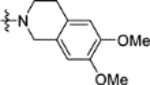
|
3.4 ± 0.2 |
| 16e |
|
12 ± 1 | 16l |
|
0.67 ± 0.03 |
| 16f |
|
4.7 ± 0.2 | 16m |
|
0.67 ± 0.01 |
| 16g |
|
13 ± 1 | 16n |
|
NDb |
a
53 ± 3% inhibition at 50 μM concentration.
b
44 ± 5% inhibition at 50 μM concentration.