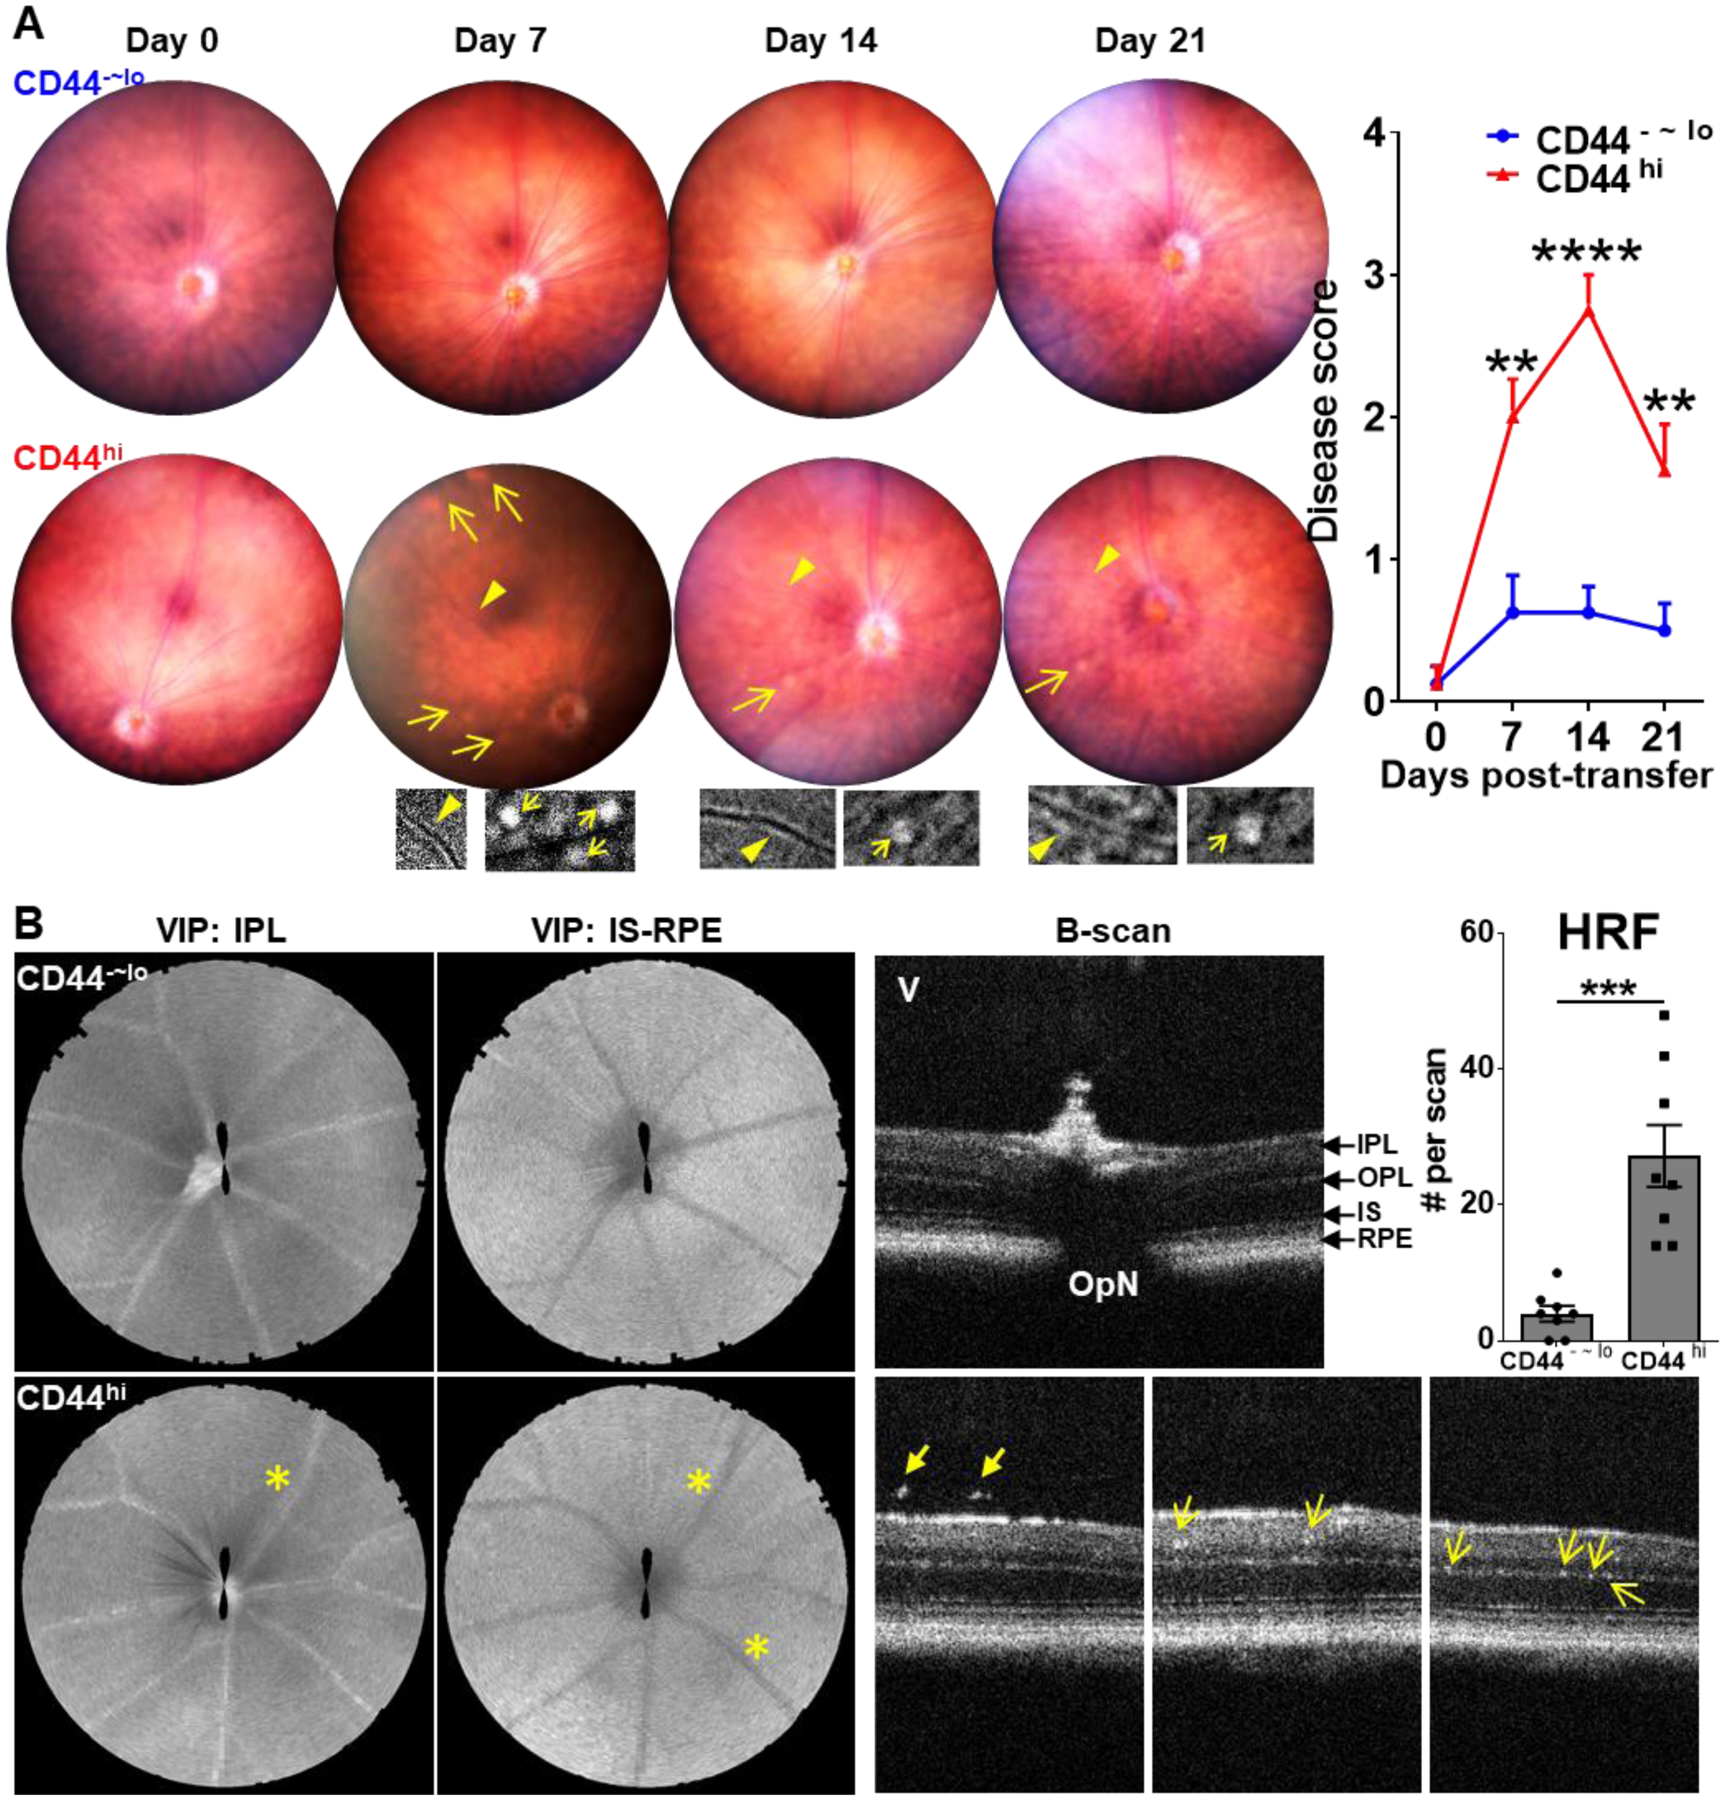
Figure 4. Chronic uveitis-derived memory T cells specifically induce uveitis.

The freshly sorted memory (CD44hi) and control (CD44−~lo) T cells from CAU mice were adoptively transferred (AT) to naive Rag1−/− mice, and the recipients were evaluated by weekly fundoscopic and OCT examinations for 21 days. (A) Representative weekly digital fundus images from one same animal receiving memory T cells exhibit retinal blood vessel cuffing (arrows) and multiple retinal small lesions (arrowheads). Inserts show the enlarged changes in the corresponding areas in a grayscale. Disease scores during the observation period are summarized as mean ± SEM (n = 8 per group) from one experiment out of two performed. (B) OCT in segmental VIP views shows engorged blood vessels at IPL and IS-RPE layers (asterisk), and B-scan shows the hyperreflective vitreous opacities (thick arrow) and multiple hyperreflective foci (HRF, indicated by thin arrow) in the retina at day 14. Data in summary bar graphs represent mean ± SEM from one experiment out of two performed. IPL, inner plexiform layer; IS, inner segment; OPL, outer plexiform layer; OpN, optic nerve; RPE: retinal pigment epithelium; V, vitreous; VIP, volume intensity projection. **, p < 0.01; ***, p < 0.001; ****, p < 0.0001.
