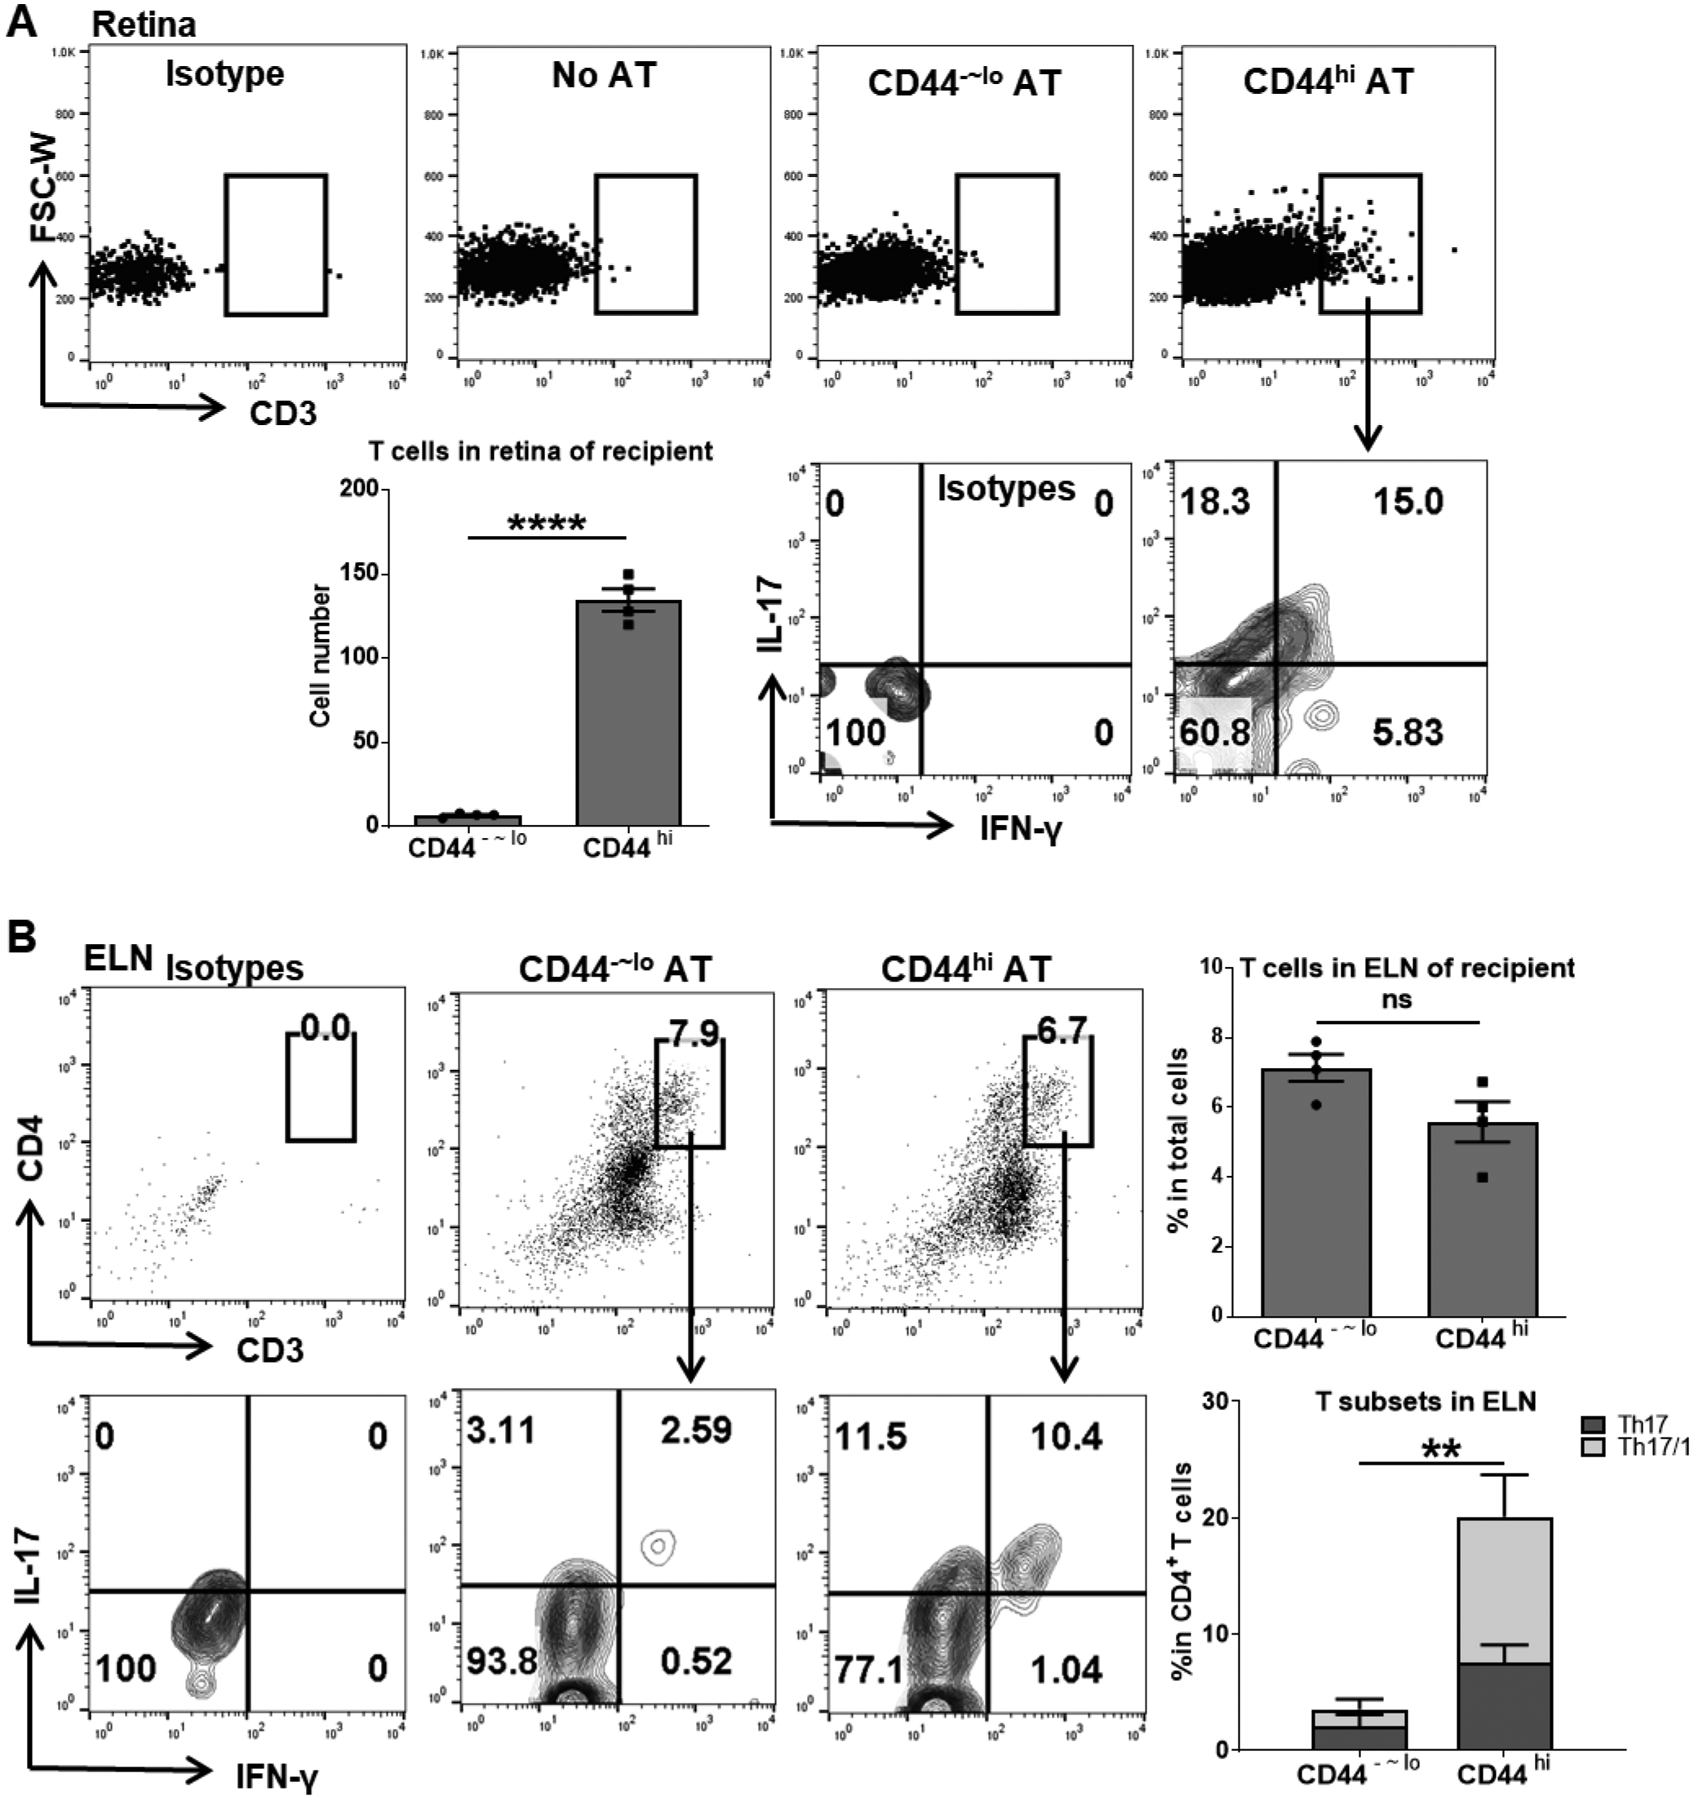
Figure 6. Adoptively transferred memory T cells specifically migrate to the retina and its draining lymph nodes by producing both IL-17 and IFN-γ.

At day 14 post-transfer, the retina (A) and eye-draining lymph nodes (ELN) (B) of recipients were analyzed for T cell infiltration and their cytokines production by flow cytometry. Bar charts summarize the total T cells or Th17 and Th17/1 subsets as mean ± SEM (n = 4 per group) from one representative experiment out of two performed. The absolute numbers of T cells infiltrated in the retinal tissue were extrapolated from the total numbers of live cells isolated from each eye. AT, adoptive transfer. **, p < 0.01; ****, p < 0.0001; ns, not significant.
