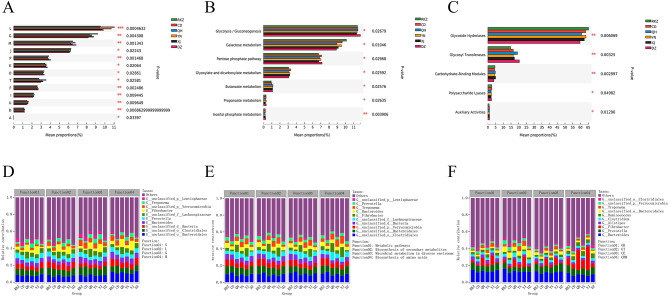
Fig. 5.
Column chart of functional difference analysis in clusters of orthologous genes (COG) (A), Kyoto Encyclopedia of Genes and Genomes (KEGG) (B), and Carbohydrate-Active enZYme (CAZy) (C). The ordinate represents the name of species at different taxonomic levels; the abscissa represents the percentage value of the abundance of a certain species in the sample; different colors represent different groups. Species and functional contributions are indicated in COG (D), KEGG (E), and CAZy (F): The abscissas in the figures represent the corresponding sample groups, and the ordinates represent the relative contributions. *P < 0.05, ** P < 0.01, *** P < 0.001

