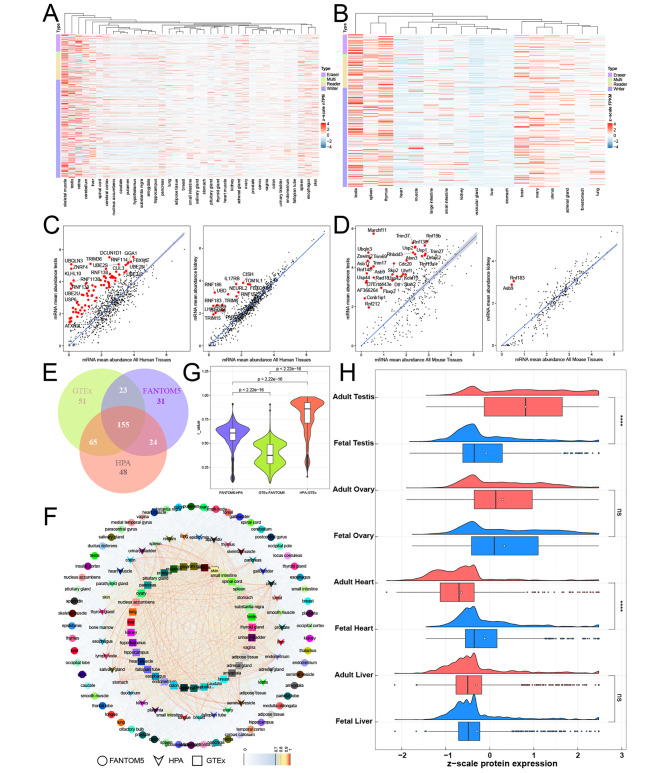
Fig. 1.
Expression pattern of UBRs across tissues. (A-B) Heatmap of UBRs expression levels. (A) human, (B) mouse. (C-D) Scatter plots that visualize the tissue-specific UBRs. (C) human, (D) mouse. Tissue-specific UBRs are labeled with red. (E) Venn diagrams of tissue-enriched UBRs. (F) Network showing Pearson correlations among tissues in three independent datasets. Internal links display the PCC. (G) Violin plots showing the distribution of PCCs among the tissues in the three datasets. (H) Raincloud shows the protein expression levels of UBRs in fetal and adult tissues

