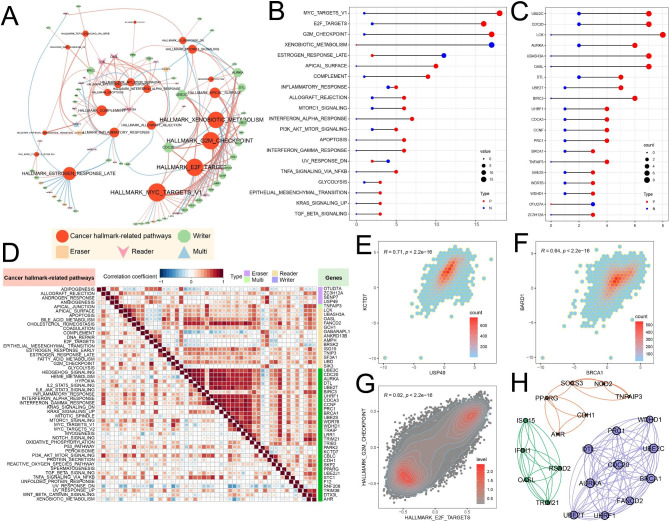
Fig. 5.
Analysis between UBRs and cancer hallmark-related pathways. (A) Correlation network between UBRs and pathways. The red line means a positive correlation and the blue line means a negative correlation. (B) Quantitative distribution of UBRs that were significantly correlated with specific pathways. (C) Quantitative distribution of pathways that were significantly correlated with specific UBRs. (D) Correlation between pathways or partial UBRs. Bottom left, correlation between pathways; top right, correlation between UBRs. (E) Correlation between USP49 and KCTD7. (F) Correlation between BRCA1 and BARD1. (G) Correlation between E2F targets pathway and G2M checkpoint pathway. (H) Subnetworks identified from the 79 UBRs’ PPI networks. Blue represents the subnetwork 1

