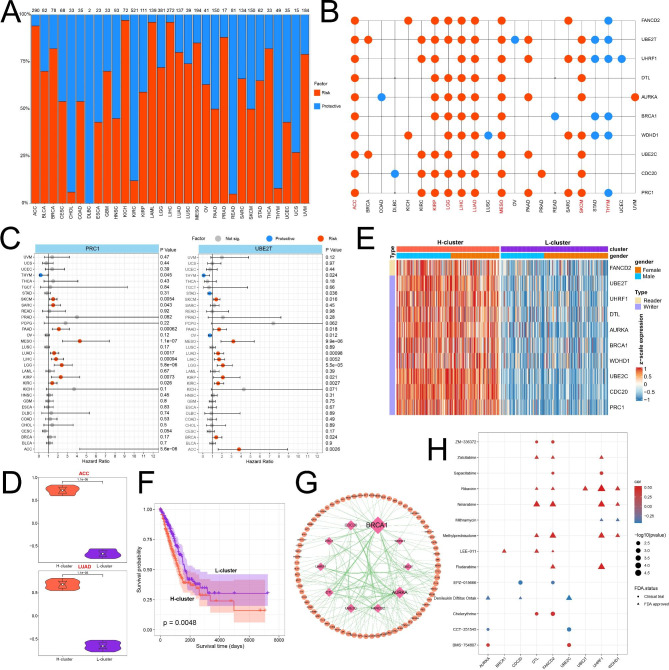
Fig. 6.
Clinical correlation analysis of UBRs in pan-cancer. (A) The quantitative distribution of UBRs affecting patient survival. (B) Impact of hub genes on patient survival. (C) HRs distribution for specific genes. (D) Violin plot showing average expression of hub genes in different clusters. (E) The expression heatmap of hub gene in LUAD. (F) Kaplan-Meier survival plots for LUAD in different clusters. (G) PPI network between hub genes and clinically actionable genes. (H) Drug sensitivity analysis of hub genes. Color represents the correlation between gene expression and drug IC50. The size of the point is inversely related to the size of the p-value. The shape represents the state of the drug, the circle represents the drug in the clinical trial stage, and the triangle represents the drug that has been approved by the FDA

