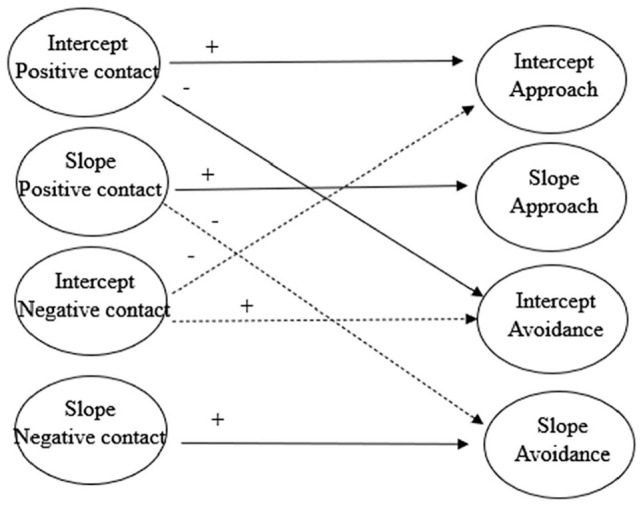
Figure 1.

Main latent growth curve model.
Note. Dashed lines indicate marginally significant effects (p = .05–.08). Nonsignificant effects and covariances between predictors and those between outcomes were estimated but not shown for visual clarity.

Main latent growth curve model.
Note. Dashed lines indicate marginally significant effects (p = .05–.08). Nonsignificant effects and covariances between predictors and those between outcomes were estimated but not shown for visual clarity.