Fig. 6.
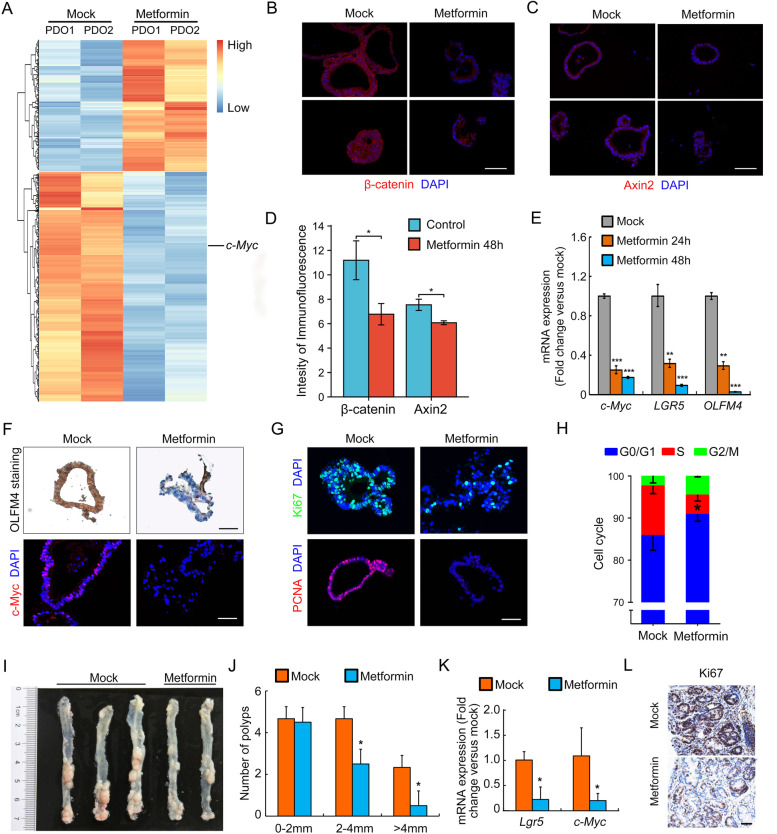
Metformin inhibited HRCA growth by restricting stemness maintenance in vitro and in vivo. A Clustered heatmap of log2-transformed RPKMs showed the differentially expressed genes (DEGs) after metformin treatment (5 mM, 24 h). The organoids treated with metformin were cultured from P4 and P8. c-Myc was marked. B, C Immunofluorescent staining of β-catenin and Axin2 on organoids in metformin-treated (48h) and mock groups. Scale bar, 50 μm. (right panel). D Quantification of fluorescence intensity in organoids was performed and analyzed for β-catenin and Axin2. E After metformin treatment for 24 and 48 h, HRCA-PDOs were harvested to perform qRT-PCR for evaluation of the mRNA expression of LGR5, OLFM4 and c-Myc. F Expression of OLFM4 and c-Myc in HRCA-PDOs after metformin treatment for 48 h were detected by immunohistochemical staining and immunofluorescent staining, respectively. Scale bar, 50 μm. (right panel). G HRCA-PDOs were harvested to examine the expression of proliferation markers including Ki67 and PCNA by immunofluorescence staining after metformin treatment for 48 h. A representative result of three independent experiments was shown. Scale bar, 50 μm. H FACs analysis revealed an obvious cell cycle change of adenoma cells after metformin treatment (5 mM, 48 h). FACs, fluorescence-activated cell sorting. I, J Bright-field image showed the colorectal tumor formation in colon between mock and metformin-treated groups (left panel) and quantification of colorectal tumors in mice (n = 5 in control group and n = 4 in metformin-treated group) were counted and statistically analyzed (right panel). K–L qRT-PCR examination of expression of Lgr5 and c-Myc mRNA levels and immunohistochemical staining of proliferative marker Ki67 in colorectal tumors between mock and metformin-treated groups. All data were presented as mean ± SD (n = 4-5) and subjected to one-way ANOVA by the Bonferroni post hoc test in E, Two-way ANOVA followed by the Bonferroni post hoc test in H and J and Student’s t-test in D and F. * indicates P < 0.05, ** indicates P < 0.01, and *** indicates P < 0.001 versus mock group

