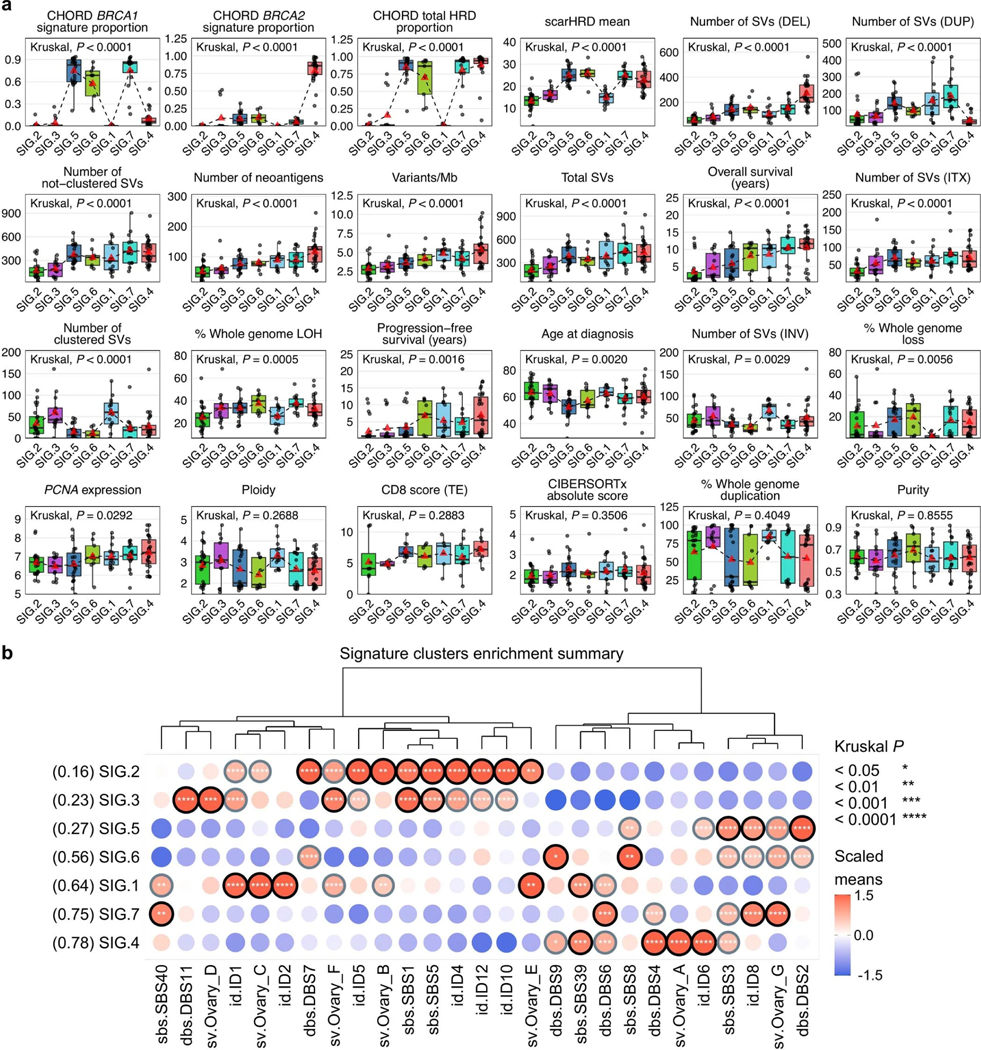
Extended Data Fig. 5: Clinical and genomic features of mutational signature clusters.

a, Boxplots summarize numerical, clinical and genomic features by mutational signature cluster; points represent each sample, boxes show the interquartile range (25–75th percentiles), central lines indicate the median, whiskers show the smallest/largest values within 1.5 times the interquartile range, red triangles indicate the mean, and dotted lines join the means of each cluster to visualize the trend. The Kruskal–Wallis test P values displayed are Benjamini-Hochberg adjusted P values. Features are ordered by their significance and clusters are ordered by the proportion of long-term survivors. CD8 scores were available for n = 54 primary tumors as previously measured by immunohistochemistry23 and scored as density of CD8+ T cells (average cells/mm2, y axis) in the tumor epithelium (TE). HRD, homologous recombination deficiency; DEL, deletions; DUP; duplications; SV, structural variants; Mb, megabase; ITX, intrachromosomal rearrangements; LOH, loss-of-heterozygosity; INV, inversions. b, Bubble plot summary of mutational signature enrichment across signature clusters. The dendrogram is reused from the signature clustering (Fig. 3) to order the mutational signature types (columns). Mutational signature clusters (rows) are sorted by the proportion of long-term survivors in each cluster, indicated in brackets. The color and size of bubbles indicate the z-score scaled values of the mean signature exposure per cluster. Bubbles with a z-score of greater than or equal to 1 have a black border and bubbles with a z-score of greater than 0.5 but less than 1 have a gray border. Bordered bubbles have asterisks filled in to indicate Kruskal–Wallis test P values adjusted for multiple testing using Benjamini-Hochberg correction.
