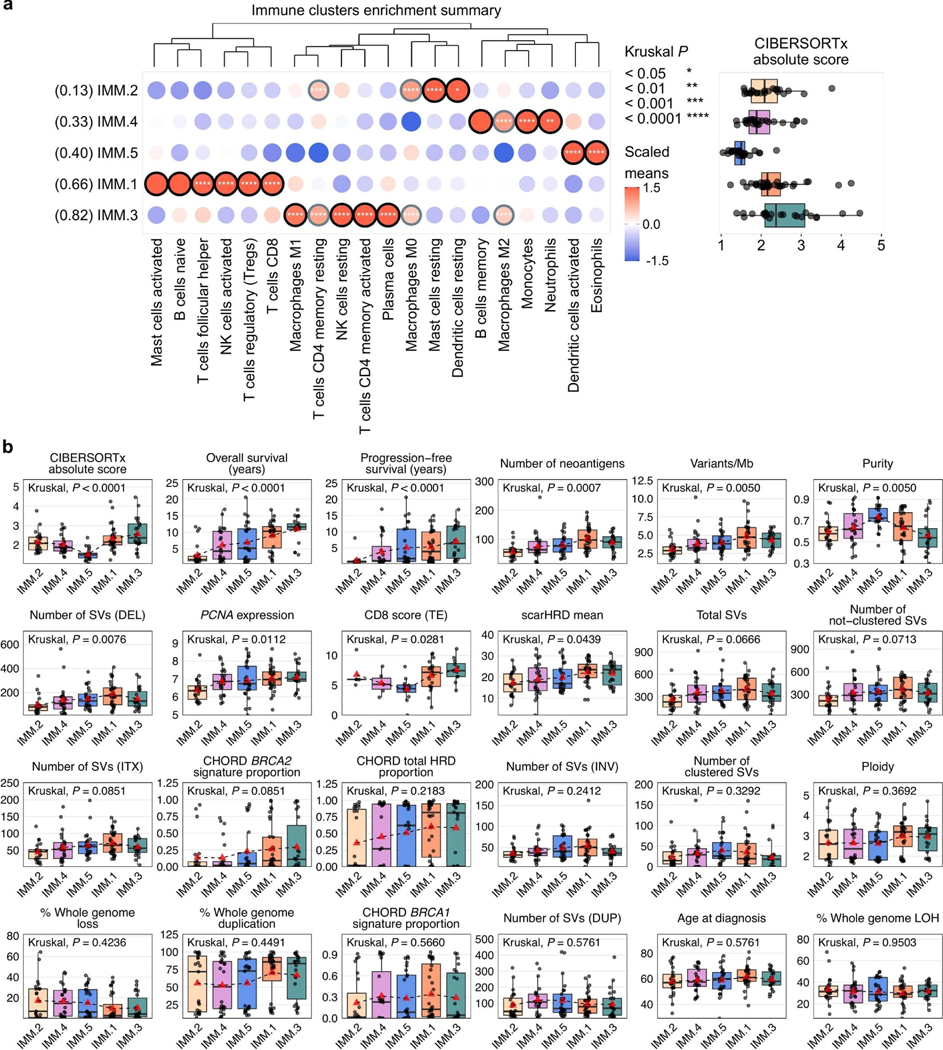
Extended Data Fig. 8: Genomic and clinical features of immune clusters.
a, A condensed bubble plot of the various LM22 cell types used for the immune clustering (IMM.1 n = 32, IMM.2 n = 23, IMM.3 n = 22, IMM.4 n = 24, IMM.5 n = 25). The dendrogram is reused from the immune clustering (Fig. 5a) to order the cell types. Immune clusters (rows) are sorted by the proportion of long-term survivors indicated in brackets. The color and size of bubbles indicate z-score scaled values of the mean abundance of cell types per cluster. Bubbles with a z-score of greater than or equal to 1 have a black border, and those with a z-score of greater than 0.5 but less than 1 have a gray border. Asterisks indicate Kruskal–Wallis test P values adjusted for multiple testing using Benjamini-Hochberg correction. Boxplots (right) summarize CIBERSORTx absolute scores of each cluster; points represent each sample, boxes show the interquartile range (25–75th percentiles), central lines indicate the median, and whiskers show the smallest/largest values within 1.5 times the interquartile range. b, Boxplots summarize numerical, clinical and genomic features by immune cluster (IMM.1 n = 32, IMM.2 n = 23, IMM.3 n = 22, IMM.4 n = 24, IMM.5 n = 25); points represent each sample, boxes show the interquartile range (25–75th percentiles), central lines indicate the median, whiskers show the smallest/largest values within 1.5 times the interquartile range, red triangles indicate the mean, and dotted lines join the means of each cluster to visualize the trend. The Kruskal–Wallis test P values displayed are Benjamini-Hochberg adjusted. Features are ordered by their significance and clusters are ordered by the proportion of long-term survivors. CD8 scores were available for n = 54 primary tumors as previously measured by immunohistochemistry23 and scored as density of CD8+ T cells (average cells/mm2, y axis) in the tumor epithelium (TE). HRD, homologous recombination deficiency; DEL, deletions; DUP; duplications; SV, structural variants; Mb, megabase; ITX, intrachromosomal rearrangements; LOH, loss-of-heterozygosity; INV, inversions.

