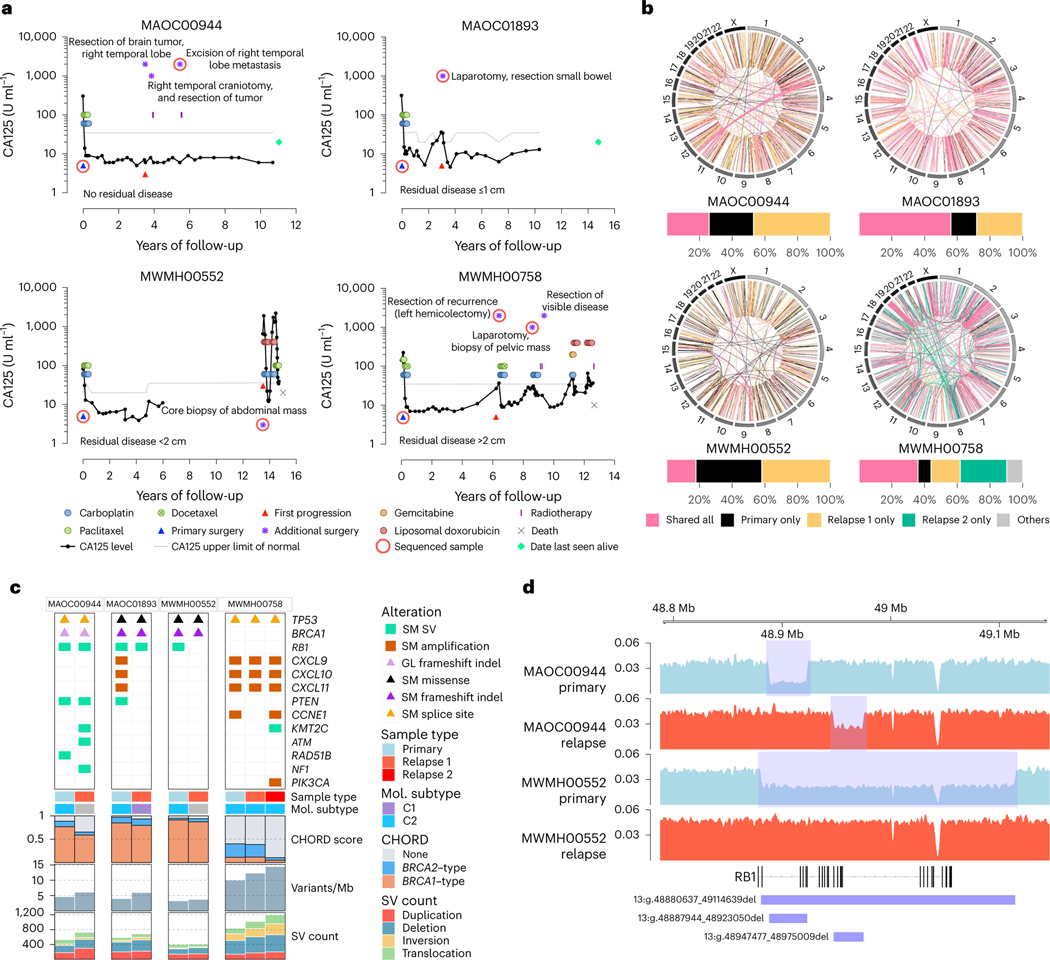
Fig. 2 |. Genomic analysis of matched primary and recurrent HGSC in four long-term survivors.
a, Serum CA125 levels (solid black lines) on a log scale (y axis) of long-term survivor relapse cases (n = 4), measured at various intervals over time (x axis). The upper limit of normal for CA125 (dotted gray lines) can vary depending on the CA125 assay performed. Colored circles and rectangles represent different lines of treatment as indicated. All patients were diagnosed with stage IIIC HGSC at primary surgery (blue triangle). Also indicated is the time of first progression (red triangle), additional surgeries (purple asterisks), sequenced sample (red ring), death (gray cross) or date last seen alive (green diamond). b, Circos plots summarize the structural variants (lines) that are shared or unique between primary and relapse samples for each case as indicated. Bar plots below show the proportion of total shared and unique structural variants (SVs) in each patient. In the patient with two relapse samples, structural variants that were shared only by two tumor samples were classified as “others”. c, Somatic (SM) and germline (GL) alterations in primary and relapse tumor samples in genes of interest (rows). Each sample (column) is annotated with sample type (primary or relapse) and molecular (Mol.) subtype11 if RNA was available. Bars indicate the level of HRD in each tumor sample, measured as probabilities of BRCA1-type(orange) HRD, BRCA2-type(blue) HRD, or homologous recombination proficient (none, gray), as predicted by CHORD28. Bar plots at the bottom indicate somatic mutation burden in variants per megabase (Mb) and SV counts in each sample. d, BigWig tracks of DNA sequencing coverage (y axis) in two paired primary (shaded blue) and relapse (shaded red) tumor samples showing the locations (x axis) of deletions (blue rectangles) identified in RB1.

