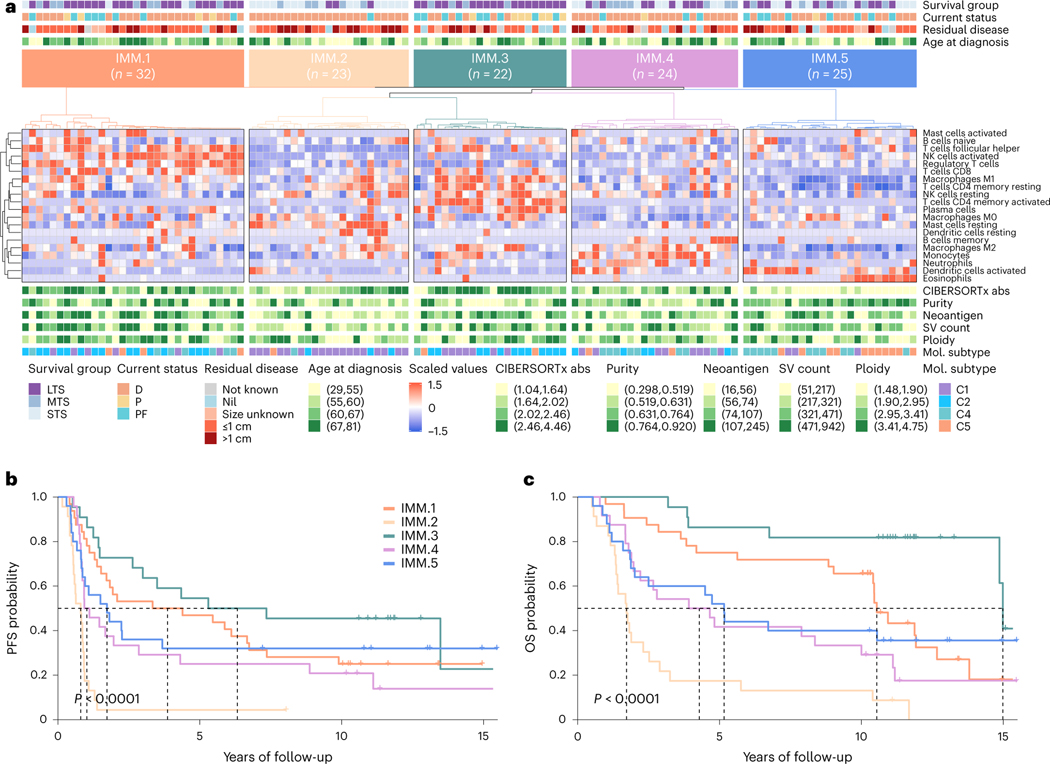
Fig. 5 |. Immune phenotypes of long-term survivors.
a, Heatmap of scaled abundance of immune cell types following consensus clustering based on CIBERSORTx26 estimated absolute abundance of immune cell types from bulk RNA-seq data of each primary tumor (n = 126). Five immune clusters were identified (IMM.1-IMM.5), and each patient (column) is annotated with survival group (LTS, long-term survivor; MTS, moderate-term survivor; STS, short-term survivor), status at last follow-up (D, dead; P, progressed and alive; PF, progression-free and alive), residual disease size and age at diagnosis (quartiles). CIBERSORTx absolute (abs) immune scores, tumor purity, neoantigen counts, structural variant (SV) counts and ploidy estimates are shown as quartiles. Tumor samples are also classified according to molecular subtype11 (Cl, mesenchymal; C2, immunoreactive; C4, differentiated; C5, proliferative). b,c, Kaplan-Meier analysis of progression-free survival (b) and OS (c) in patients stratified by immune clusters. P values were calculated by Mantel-Cox log-rank test, and dotted lines indicate median survival.

