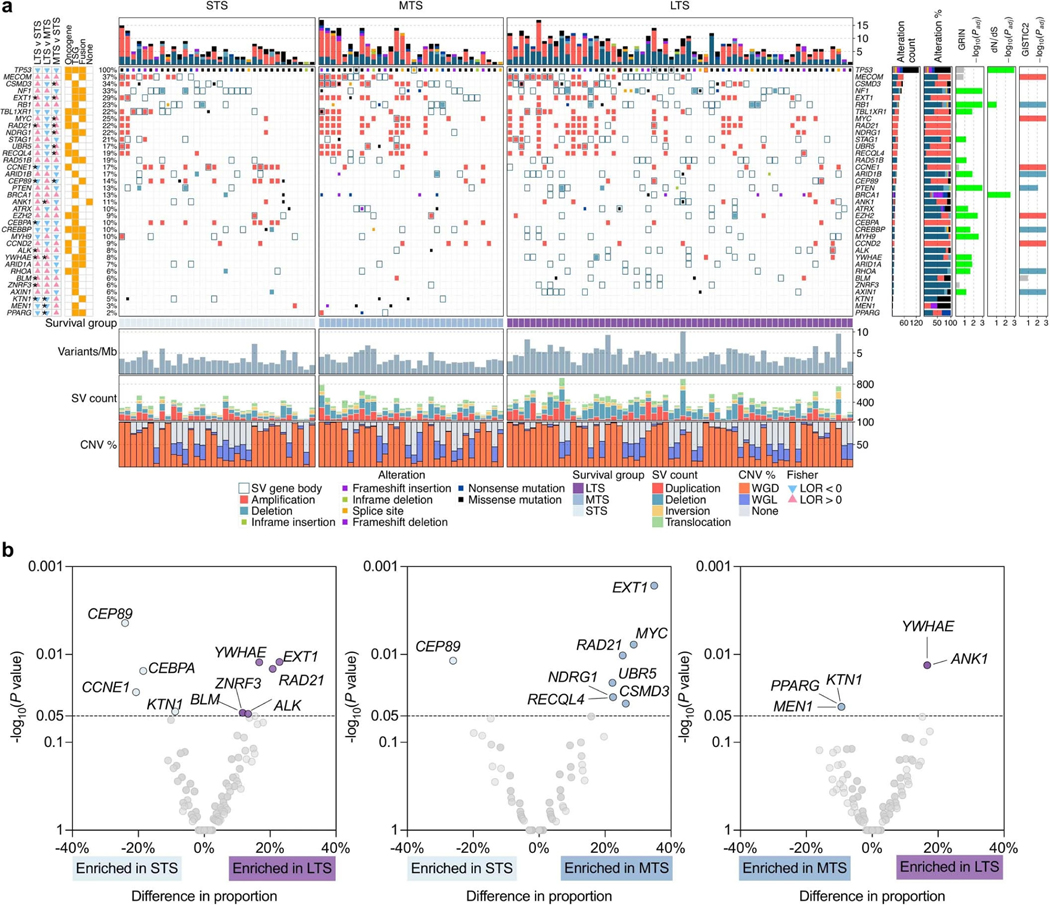
Extended Data Fig. 2: Frequently altered cancer genes across survival groups.

a, Overview of somatic alterations in driver genes detected by GRIN, dNdScv, GISTIC, and/or in cancer-associated genes (COSMIC Cancer Gene Census) that are enriched in a survival group relative to another survival group. From left: two-sided Fisher’s test of the difference in proportions of altered samples between survival groups, triangles and color indicate direction of the log odds ratio (LOR; blue = down, pink = up), asterisks indicate P value < 0.05 (see Supplementary Table 6 for P values), P values were not adjusted for multiple comparisons; role of gene in COSMIC Cancer Gene Census (TSG, tumor suppressor gene); genomic alterations split by survival groups, bars at the top indicate the number of alterations in each listed gene per patient; bar plot of the number of samples with an alteration (alteration type indicated by color); bar plots showing the proportion of alteration types per gene; P values were calculated using the genomic random interval (GRIN) statistical model (one-sided) for recurrent structural variants (SV) (see Supplementary Data 2 for GRIN P values), the dNdScv likelihood-ratio test (two-sided) for recurrent base substitutions and small-scale deletions and insertions (see Supplementary Data 1 for dNdScv P values), and GISTIC2 permutation-of-markers test (one-sided) for recurrent copy-number variants (CNV) with red indicating amplification and blue indicating deletion (see Supplementary Data 3 for GISTIC2 P values), P values were adjusted for multiple comparisons using the Benjamini-Hochberg procedure (dNdScv, GISTIC2) or the robust false discovery rate procedure (GRIN) and are shown as negative log10 P values and capped at 0.001 for display purposes. Each patient (column) is annotated with survival group (LTS, long-term survivor; MTS, moderate-term survivor; STS, short-term survivor). Below the alterations are bar plots indicating somatic mutation burden in variants per megabase (Mb); SV count including duplications, deletions, inversions and intrachromosomal rearrangements; and the proportion of the tumor genome that is duplicated (WGD) or lost (WGL). b, Pairwise comparison of the alteration frequencies between survival groups for genes in the COSMIC Cancer Gene Census. The difference in relative alteration frequency is shown on the x-axis and the P value (Fisher’s test, two-sided) is shown on the y-axis. Symbols of genes with P values < 0.05 are displayed. Multiple hypothesis correction was not applied in this analysis as adjusted P values were all greater than 0.1. Alterations in this analysis included non-synonymous mutations, homozygous deletions, amplifications and structural variants in coding genes that are expressed.
