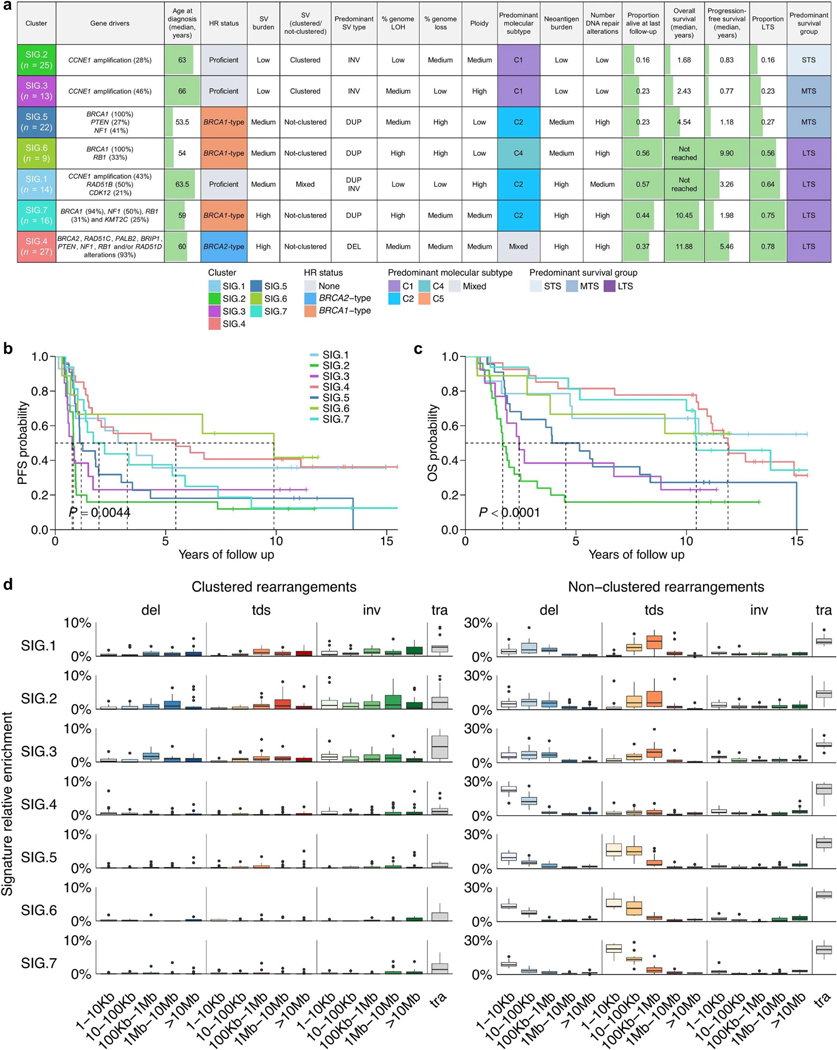
Extended Data Fig. 3: Key features of mutational signature clusters and associated survival outcomes.
a, Summary of the key clinical and genomic features of each mutational signature cluster. Clusters are ordered top to bottom by lowest to highest proportion of long-term survivors (LTS) in each cluster. HR, homologous recombination; LOH, loss-of-heterozygosity; SV, structural variant; MTS, moderate-term survivor; STS, short-term survivor; DUP, duplications; DEL, deletions; INV, inversions. b, Kaplan–Meier analysis of progression-free and c, overall survival in patients stratified by signature clusters. P values calculated by Mantel–Cox log-rank test and dotted lines indicate median survival. d, Boxplots summarize the proportion (y-axis) of clustered and nonclustered rearrangements by size (x-axis) and type, for each mutational signature cluster (SIG.1 n = 14, SIG.2 n = 25, SIG.3 n = 13, SIG.4 n = 27, SIG.5 n = 22, SIG.6 n = 9, SIG.7 n = 16); boxes show the interquartile range (25–75th percentiles), central lines indicate the median, whiskers show the smallest/largest values within 1.5 times the interquartile range and values outside it are shown as individual data points. Del, deletions; tds, tandem duplications; inv, inversions, tra, interchromosomal translocations; Kb, kilobase; Mb, megabase.

