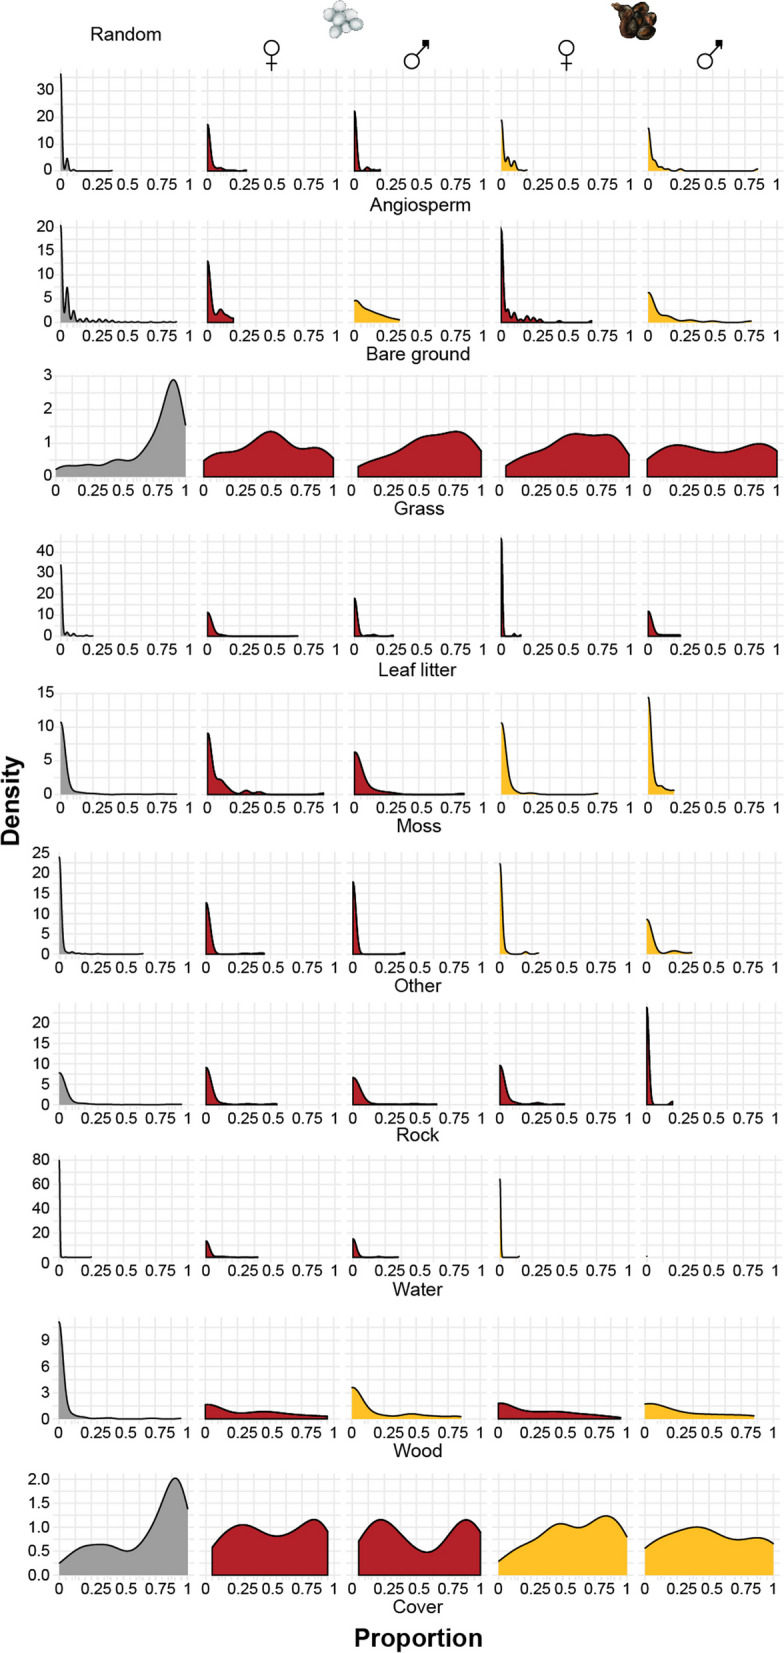
Fig. 2.

Proportion of habitat component and factors that performed best (as assessed by DIC) in explaining variance in each habitat component. Different colours in the kernel density plot represent factors that differed significantly in the best performing model. The habitat used by lizards differed in all its components from the study area available (‘Random’; grey colour). The combination of red and yellow coded colours indicated that either parity mode or sex was another significant factor. For example, in cases where parity mode was a significant factor, the second and third column (oviparous males and females; coded red) differed from the fourth and fifth column (viviparous males and females; coded yellow)
