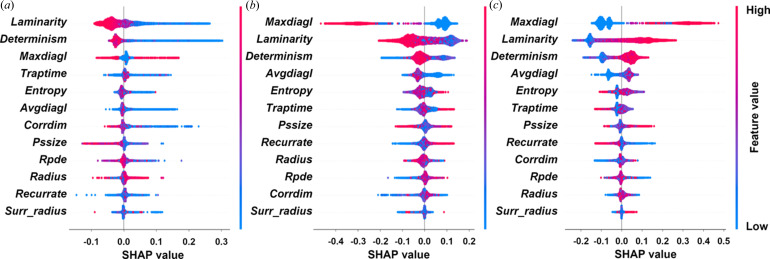
Figure 6.
SHAP swarm plots for the (a) monometric, (b) dimetric and (c) trimetric cells, applied to the RF classification of the RQA descriptors of PDF profiles. In these plots each point is a Shapley value for a feature and an instance. The position on the y axis is determined by the feature and on the x axis by the Shapley value, which represents the impact on the model output. The colour represents the value of the feature from low to high. Overlapping points are jittered in the y axis direction, so we get a sense of the distribution of the Shapley values per feature. The features are ordered according to their importance.

