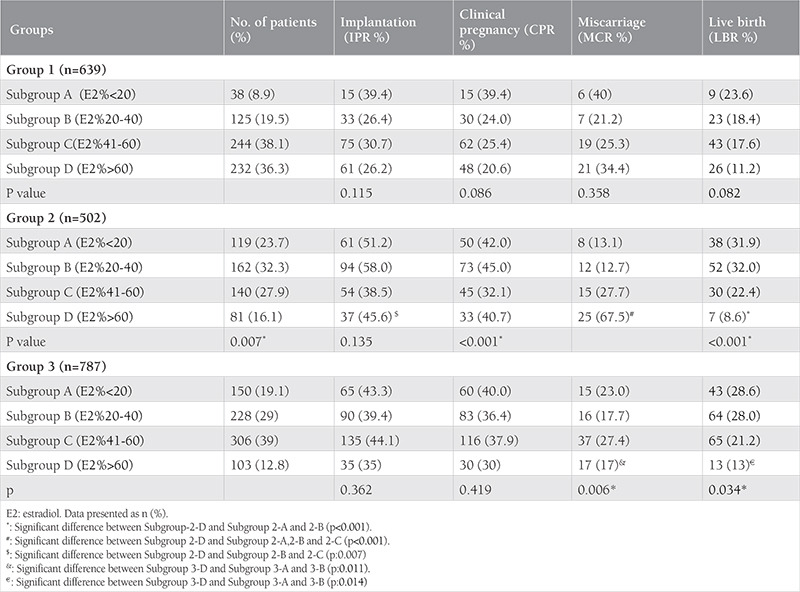
Table 2. Live birth, abortion, implantation and clinical pregnancy rates of fresh embryo transfer cycles in poor responders (Group 1), high ovarian responders (Group 2) and women with normal ovarian responses (Group 3) in subgroups with different E2 declines on the embryo transfer day 3.