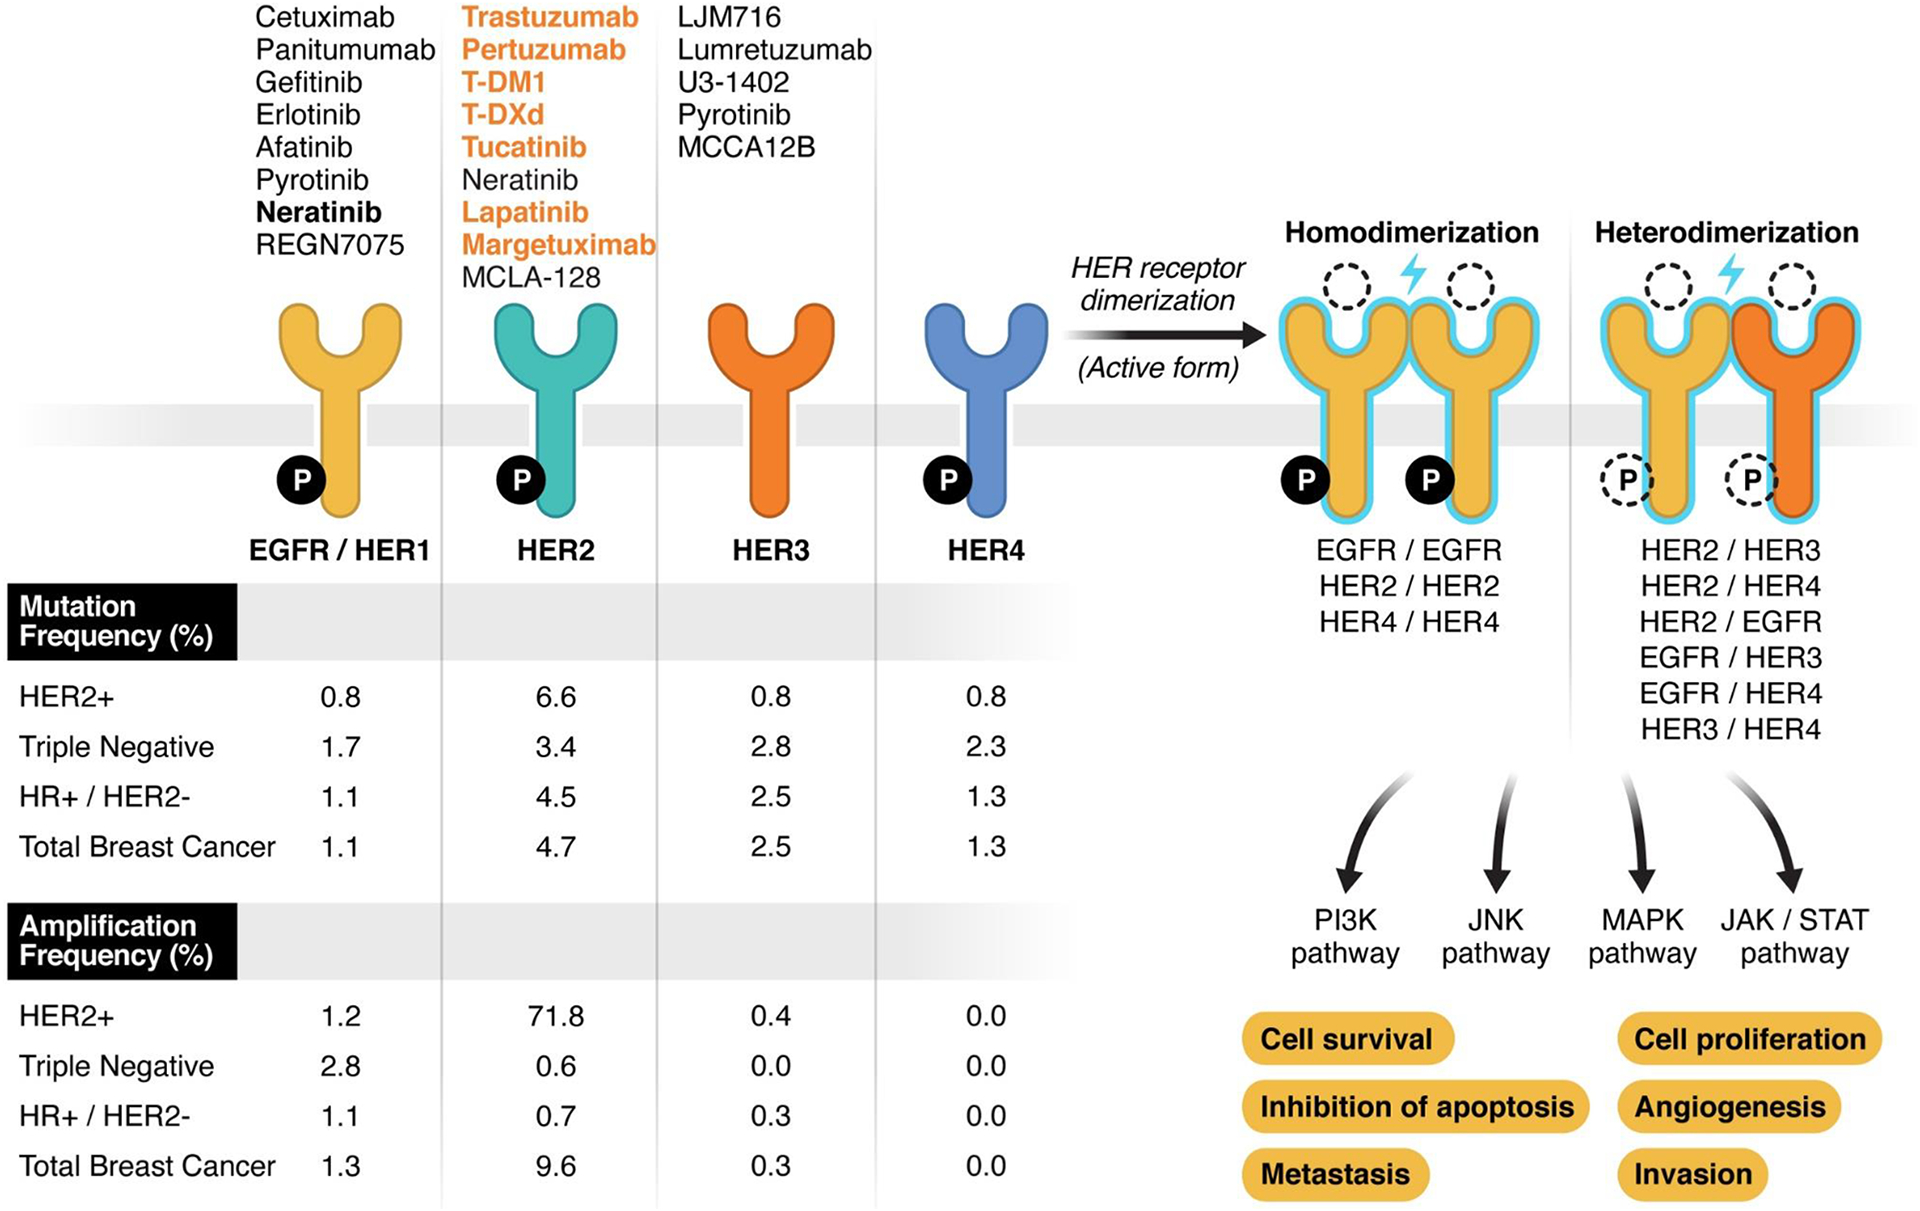
Figure 1.

Schematic representation of ERBB-family receptors. On the right part of the figure, the 4 receptors have been represented: on upper side, FDA-approved (orange) and experimental (black) targeted agents for each receptor; on the lower side amplification and mutation frequency is reported. The genomic alterations frequency has been extracted from MSKCC sequencing data by MSK-IMPACT including 1918 breast cancer samples (published data, Razavi et al. Cancer Cell 2018 https://doi.org/10.1016/j.ccell.2018.08.008 ). ER/PR and HER2 status have been defined as the last status determined per SOC that guided the therapeutic choice at the time of the data collection. The right part of the figure represents all possible combinations of dimerization (active form) of ERBB-receptors along with the downstream molecular pathway and the effect of their activation on breast cancer cells. Ligand and intracellular phosphorylation (P) are represented with dotted lined because their status vary across the receptors/dimers. Specifically: all the receptors are active with the phosphorylation of the intracellular domain except HER3. In normal conditions, all receptors have a ligand-dependent activity except HER2.
