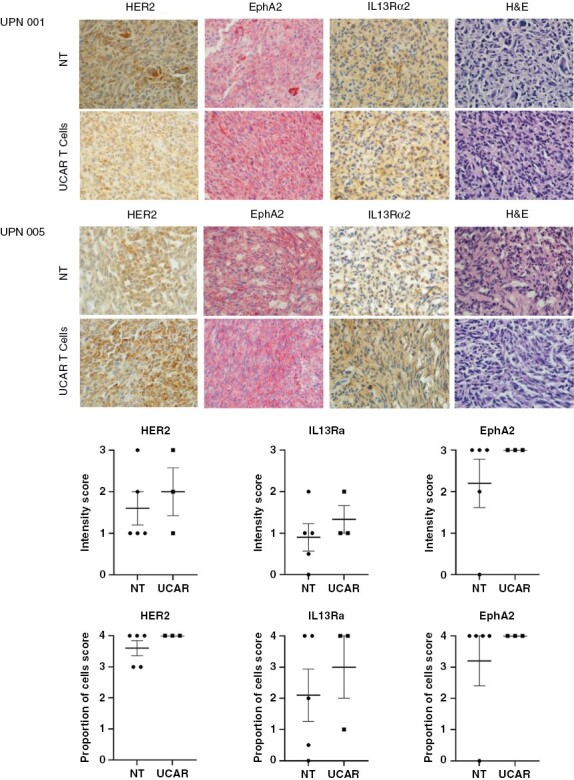
Fig. 6.

(A) Immunohistochemistry of UPN001 and UPN005 xenografts from frozen mouse brain sections after treatment with T cells when mice reached the humane point for euthanasia. GBM tumor xenografts of mice (N = 3-5 per group) from the Non-transduced (NT) and UCAR T-cell treated groups were characterized post treatment using immunohistochemistry staining for HER2, EphA2, and IL13Rα2, DAPI, at 40x magnification. Representative images shown. (B) Graphic representation of HER2, EphA2, and IL13Rα2 positively stained cells in brain sections of mice quantified collectively from 40x high power fields in each group. Each data point represents a specimen examined for intensity of staining and proportion of cells showing positivity for the examined antigen. Intensity: 1+ (weak); 2+ (moderate); 3+ (strong). Proportion of cells staining: 1+ (1-25%); 2+ (>25-50%); 3+ (>50-75%); 4+ (>75%). Error bars represent the Mean +/- SEM.
