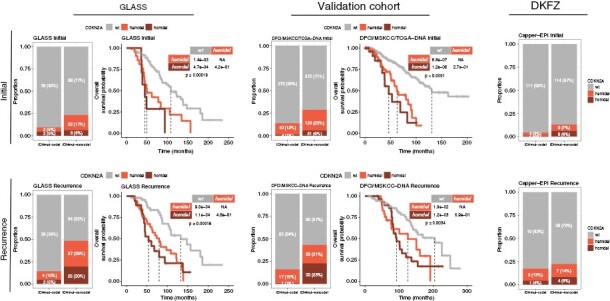
Figure 1.

Distribution of CDKN2A homozygous deletion, hemizygous deletion and wild type (wt) across six IDHmut glioma cohorts. The discovery cohort consists of the GLASS DNAseq and DNA methylation profiling datasets. The validation cohort consists of the DFCI, MSKCC, and TCGA datasets, with further validation in DKFZ methylation profiling dataset. Survival analyses are specific to IDHmut-noncodel gliomas. Upper panel depicts initial cases; lower panel depicts recurrent cases. Stacked bar plots showing the total number and relative proportion of cases with CDKN2A homozygous deletion, hemizygous deletion and wt, separated by molecular subtype into columns representing IDHmut-codel and IDHmut-noncodel. Fisher’s exact test was applied as a statistical test to compare initial and recurrent gliomas. Kaplan–Meier survival plots depict overall survival probability (y-axis) and survival time (x-axis). Overall survival indicates the time from diagnosis to death or last date of follow-up as censoring. Global log-rank test was applied for comparison of 3 groups, and pairwise log-rank test was applied for comparison of 2 groups. Note that the TCGA cohort included only initial glioma cases. No survival data was available for the DKFZ cohort. GLASS, Glioma Longitudinal Analysis Consortium; DFCI, Dana-Farber Cancer Institute; MSKCC, Memorial Sloan Kettering Cancer Center; TCGA, The Cancer Genome Atlas; DKFZ, Deutsches Krebsforschungszentrum.
