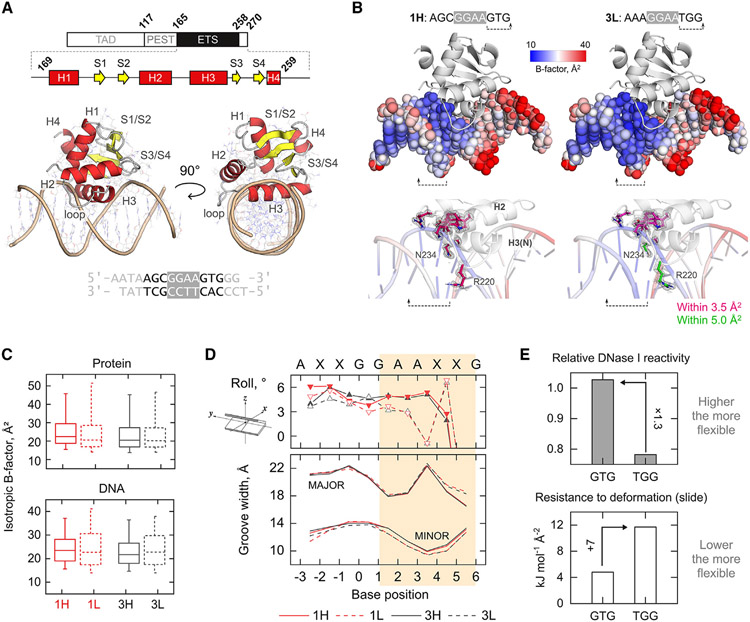
Figure 2. Structural basis of affinity perturbation by 3'-flanking sequence variation.
(A) Domain and gross structure of the high-affinity PU.1/DNA complex 1H. See also Table S1 and Figure S1.
(B) Juxtaposition of the most affinity-divergent complexes 1H and 3L. The DNA is colored by the full scale of isotropic B factors in the DNA. Note the low B factors at the 3'-flanking TGG step in 3L. Protein contacts within 3.5 Å of the TGG step are shown with magenta C atoms. In the 3L complex, R220 and N234 (green C atoms) are 1 Å or further away. 2mFo-DFc maps are rendered at 1.0 σ.
(C) Whisker-box plot of isotropic B factors. Boxes represent median ± quartiles (interquartile range) and whiskers represent the 5th/95th percentile. Complexes with 3' GTG (1L and 3L) show wider dispersion in B factor only for the DNA, regardless of the 5' flanking bases.
(D) Roll angles of base pair steps over the bound sequences. The roll trajectories become tightly segregated by affinity (1H/3H and 1L/3L) beginning at the base step +1/+2 (shaded section), corresponding to a divergence in minor groove width (P-P distance), which is systematically narrower in 1L and 3L.
(E) Sequence-dependent flexibility of the GTG over TGG steps as experimentally detected by DNase I35 and modeled by molecular mechanical resistance to slide.36,37 The literature data are detailed in Figure S2.

