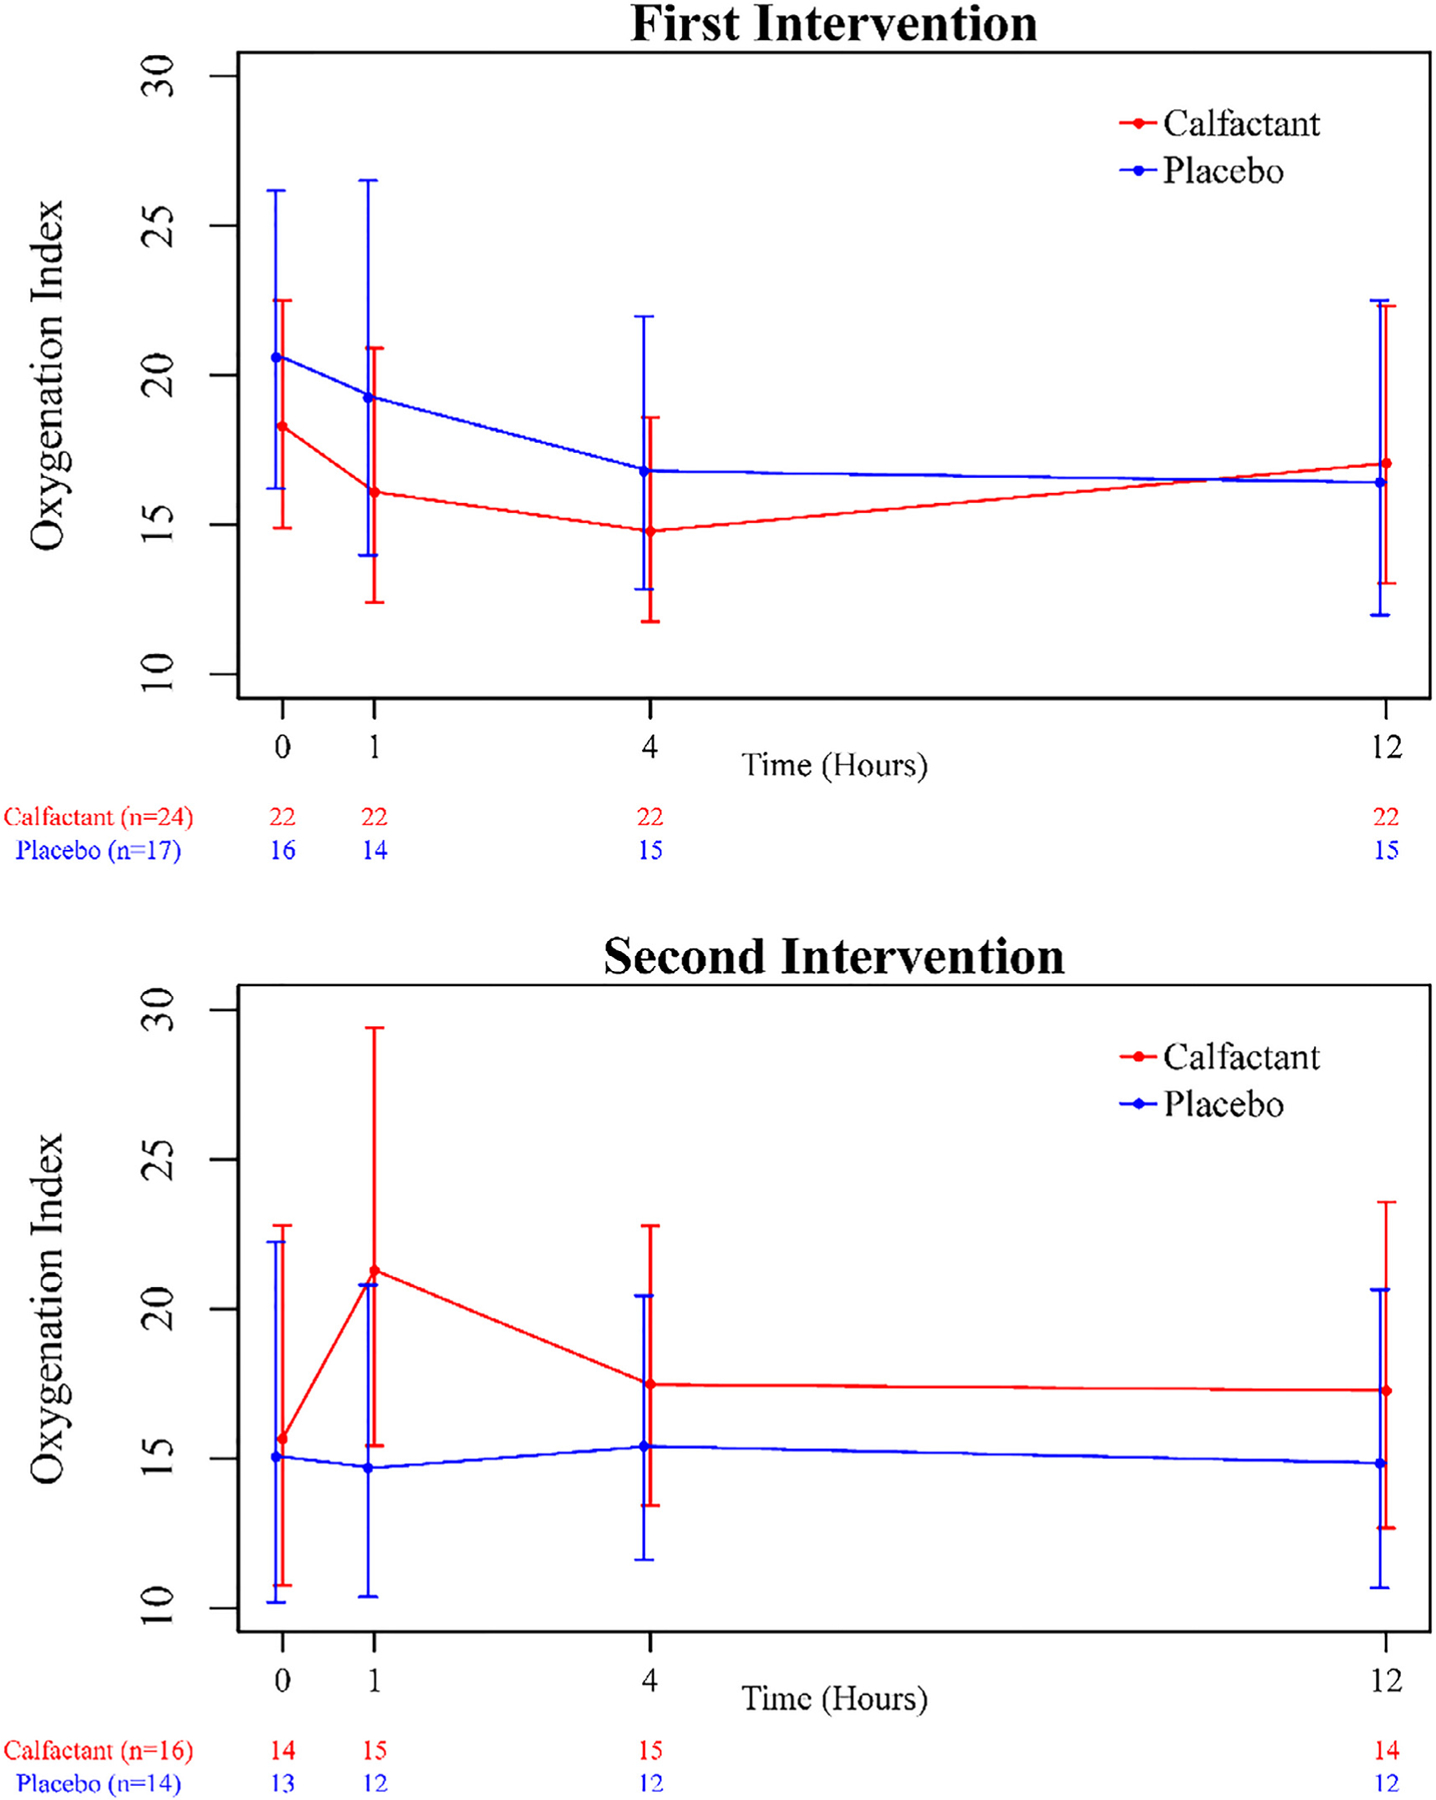
Figure 3.

Comparison of the OI at assessed time points for the 2 treatment groups. The OI was measured over a 12-hour time period immediately after study intervention for both treatment groups, adjusting for risk strata. Points plotted represent geometric means and corresponding 95% confidence intervals at each data collection time point. There were no significant differences between the treatment groups with respect to the OI over time.
